
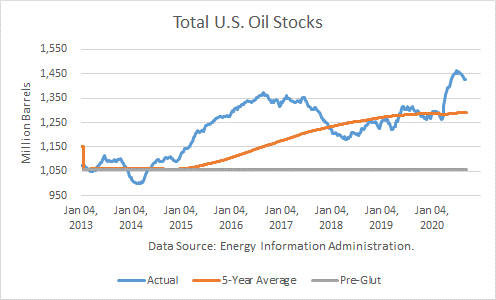
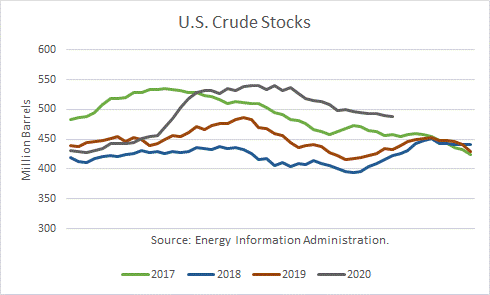
According to the Energy Information Administration, U.S. crude inventories (excluding SPR) fell by 7.2 million barrels last week to 1.395 billion, and SPR stocks dropped by 0.8 million barrels. Total stocks stand 101 mmb above the rising, rolling 5-year average and about 122 mmb higher than a year ago. Comparing total inventories to the pre-glut average (end-2014), stocks are 336 mmb above that average.
Crude Production
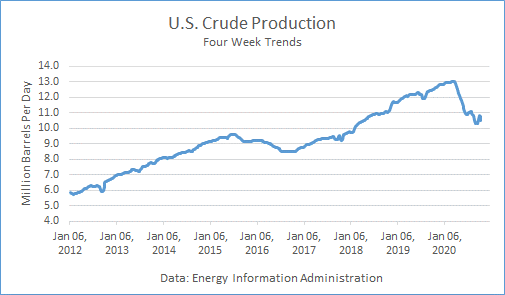
Production averaged 9.9 mmbd last week, off 600,000 b/d from the prior week due to the hurricane impact on USG operations. It averaged 10.525 mmbd over the past 4 weeks, off 16.1 % v. a year ago. In the year-to-date, crude production averaged 11.645 mmbd, off 4.5 % v. last year, about 500,000 b/d lower.
Other Supply
The EIA reported that it rose by 60,000 b/d v. last week to 7.130 mmbd. The 4-week trend in “Other Supply” averaged 7.078 mmbd, up 3.8 % from the same weeks last year. In YTD, they are unchanged from 2019.
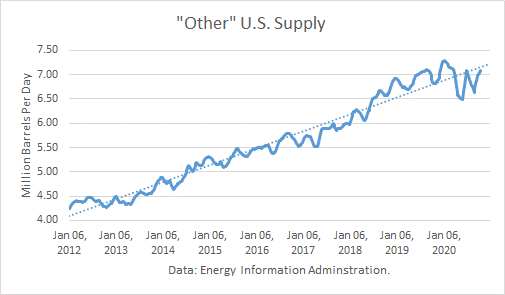
Crude production plus other supplies averaged 17.603 mmbd over the past 4 weeks, far below the all-time-high record of 20.213 mmbd.
Crude Imports
Total crude imports fell by 167,000 mb/d last week to average 5.118 mmbd. This figure was below the 4-week trend of 5.315 mmbd, which in turn was off 13.8 % from a year ago.
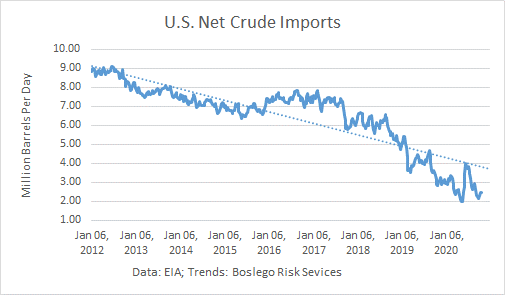
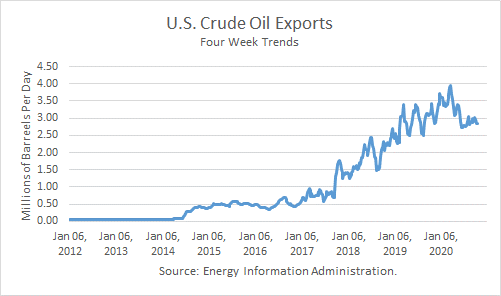
Net crude imports rose by 1.068 mmb/d because exports rose by 901,000 b/d to average 3.036 mmbd. Over the past 4 weeks, crude exports averaged 2.836 mmbd, 14.1 % lower than a year ago.
U.S. crude imports from Saudi Arabia fell by 183,000 last week, to average 262,000 b/d. Over the past 4 weeks, Saudi imports have averaged 368,000 b/d, down 11.5 % from a year ago.
Crude imports from Canada rose by 159,000 b/d last week, averaging 3.257 mmbd. Imports over the past 4 weeks averaged 3.305 mmbd, off 1.8 % v. a year ago.
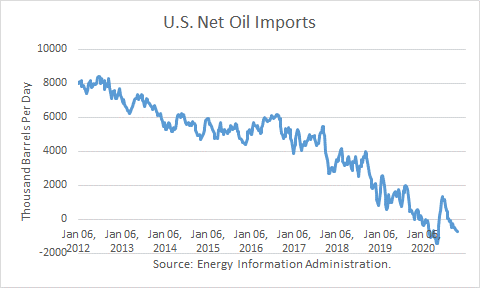
Net oil exports averaged 713,000 b/d over the past 4 weeks. That to net oil exports of 49,000 mb/d over the same weeks last year.
Crude Inputs to Refineries
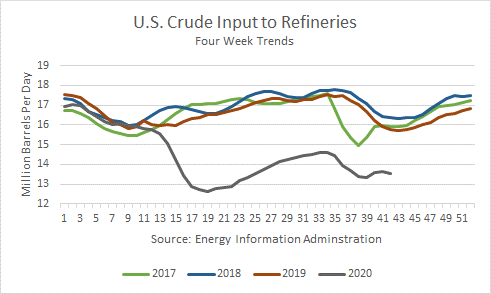
Inputs fell by 551,000 b/d last week, averaging 13.026 mmbd. Over the past 4 weeks, crude inputs averaged 13.531 mmbd, 14.1 % v. a year ago. In the year-to-date, inputs averaged 14.324 off mmbd, off 14.0% v. a year ago.
Crude Stocks
Over the past 4 weeks, crude oil demand exceeded supply by 399,000 mb/d.
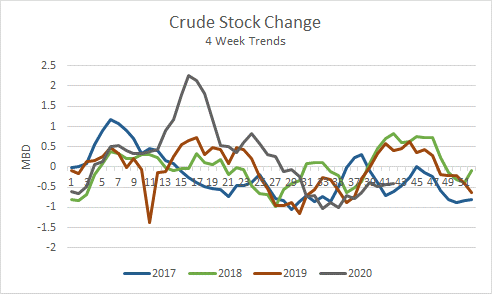
Commercial crude stocks 488.1 mmb are now 55.0 million barrels higher than a year ago.
Petroleum Products
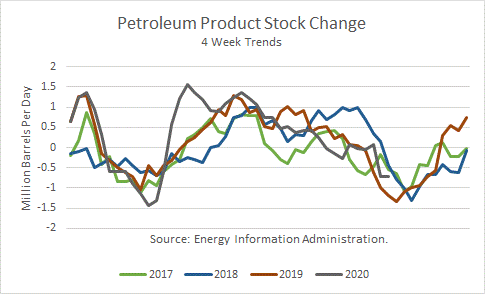
Given the recent net product stock draws, product demand has exceeded supply by 724,000 b/d.
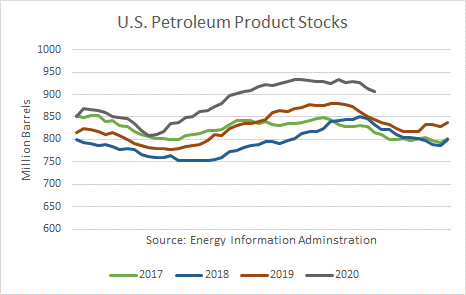
Total U.S. petroleum product stocks at 907 mmb are 62 million barrels higher than a year ago.
Product exports fell by 398,000 mmb/d last week, averaging 4.992 mmbd. The 4-week trend of 5.191 mmbd is up 3.5 % from a year ago. In the year-to-date, exports averaged 5.026 mmbd, off 1.4 % from a year ago.
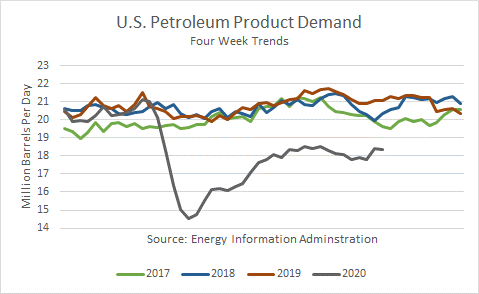
Demand
Total petroleum demand averaged 18.345 over the past 4 weeks, off 12.9 % v. last year. In the YTD, product demand averaged 18.145 mmbd, off 12.8 % v. the same period in 2019.
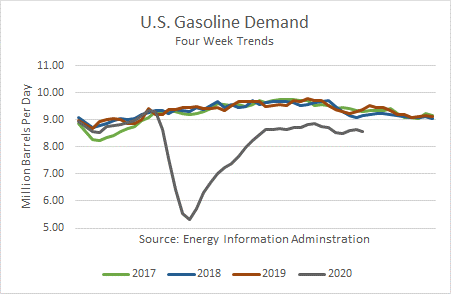
Gasoline demand at the primary stock level fell by 287,000 b/d last week and averaged 8.572 mmbd over the past 4 weeks, off 8.7 % v. the same weeks last year. In the YTD, it reported that gas demand is off 13.1 % v. a year ago.
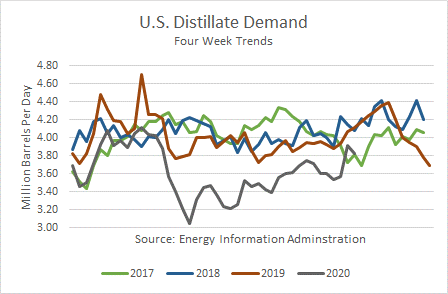
Distillate fuel demand, which includes diesel fuel and heating oil, fell by 587,000 b/d last week and averaged 3.821 mmbd over the past 4 weeks, off 7.0 % the same weeks last year. In the YTD, demand is off 9.5 % v. a year ago.
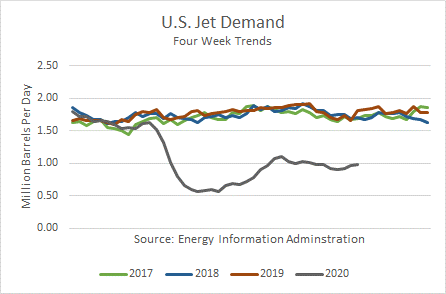
Jet fuel demand is off 45.9 % over the past 4 weeks v. last year. In the year-to-date, demand was off 40.2 % v. 2019.
Product Stocks
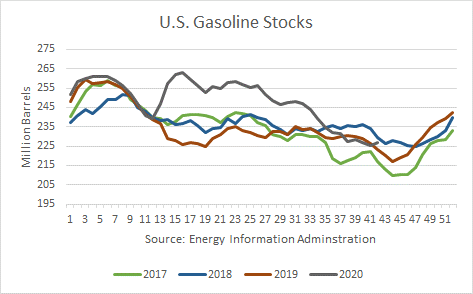
Gasoline stocks are now 3.9 mmb higher than a year ago, ending at 227.0 mmb.
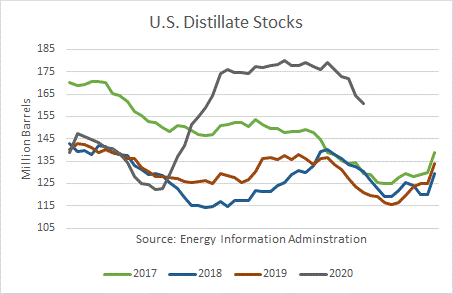
Distillate stocks are 39.9 mmb higher than a year ago, ending at 160.7 mmb.
Conclusions
Last week’s hurricane disrupted the weekly statistics once again. Crude production, imports, and refinery utilization were all down, resulting in a modest crude stock draw for the week.
Petroleum product demand trends, on the whole, reflect continuing sluggishness. Jet fuel demand fell another leg lower.
Gasoline stocks are the only area in which inventories have returned to normal levels. But that is despite weakness in demand.
Check back to see my next post!
Best,
Robert Boslego
INO.com Contributor - Energies
Disclosure: This contributor does not own any stocks mentioned in this article. This article is the opinion of the contributor themselves. The above is a matter of opinion provided for general information purposes only and is not intended as investment advice. This contributor is not receiving compensation (other than from INO.com) for their opinion.