
The broader indices have been in a blistering bull market for a year straight, only accelerating from November 2020 into April 2021. The rally has been largely uninterrupted, with minor blips in September and October of 2020 before reaching new all-time highs after new all-time highs by mid-April. The initial rally was narrowly focused on technology and the stay-at-home economy stocks. With the improving vaccine prospects, November saw a sea change with broad market participation with value stocks breaking out with huge moves to the upside. To boot, Washington's massive stimulus is being priced into the markets via fiscal and monetary stimulus. All three major indices (S&P 500, Nasdaq, and Dow Jones) are at all-time highs and continue to break into uncharted territory in what seems like a daily basis.
Stocks are overbought and at extreme valuations, as measured by any historical metric (P/E ratio, Shiller P/E ratio, Buffet Indicator, Put/Call Ratio, and percentage of stocks above their 200-day moving average) or technical metric (Bollinger Bands and Relative Strength Index - RSI). Valuations are stretched across the board, with the major averages at all-time highs and far above pre-pandemic levels. A rise in rates due to inflation could be lurking in the shadows of this frothy market.
If/When Inflation Hits
If the Consumer Price Index (CPI) continues to push higher, The Federal Reserve may be compelled to entertain the idea of raising rates finally. Although interest rate risk disproportionally impacts fixed-income investments such as bonds and annuities, stocks will undoubtedly be impacted as well. This is especially true for highly leveraged companies such as tech and super-charged growth companies. Even the prospect of higher rates hit the Nasdaq in March for a sharp decline, albeit that decline was quickly erased. This is a case in point of how quickly the markets can turn negative with the hint of rising rates which may be exacerbated in an already frothy market.
The Buffet Indicator
Warrant Buffet coined the indicator, which is the ratio of the total US stock market valuation relative to GDP (Figure 1). Currently, the current Buffet Indicator is 233%, currently, 88% (2.8 standard deviations) above the historical average, suggesting the market is strongly overbought (Figure 1).
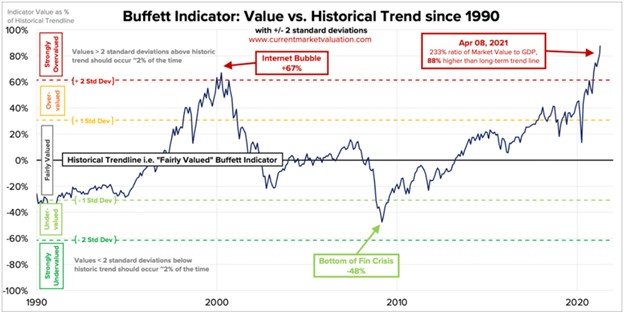
Figure 1 – Adopted from Buffet Indicator analysis via Current Market Valuation
Fundamentals – Lofty P/E Ratios
Price-to-Earnings ratios are largely discordant with the economic backdrop and at historically lofty levels. Outside of the tech bubble in 1999/2000, the current P/E ratio of the S&P 500 composite is the highest on record, exceeding that of the Roaring Twenties (Figure 2).
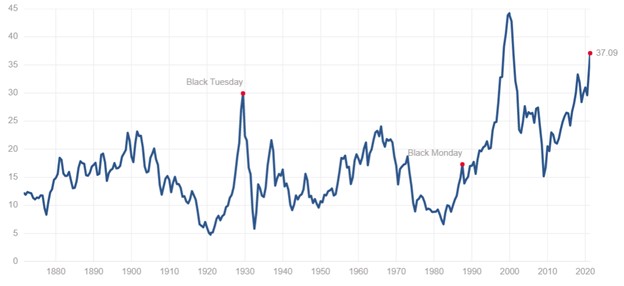
Figure 2 – S&P 500 P/E historical ratios
All-Time Highs - All Major Indices
The equity rally has been very broad, and almost every stock in the S&P 500 is in a technical uptrend (e.g., stocks trade above their 200-day moving average). Over 94% of stocks in the S&P 500 were trading in this technical uptrend into mid-April, which is the highest in seven years (Figure 3).
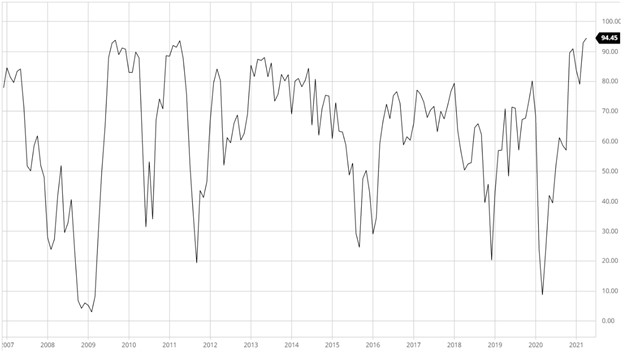
Figure 3 – S&P 500 technical trends, percentage of stocks above their 200-day moving average
Conclusion
All the major averages are setting new all-time highs after new all-time highs through mid-April. Although various outlets have been beating the overvalued drum, these narratives have been noting but wrong as the markets chug higher and higher. With interest rates at all-time lows, this inverse relationship makes sense but for how long? Once the fiscal and monetary stimulus is removed and inflation rears its ugly head, markets will inevitably turn lower. As assessed by any historical metric, these frothy levels are accompanied by current technical indicators such as Bollinger Bands and RSI suggest these markets are very overbought. Investors should heed these historical comparators as 2021 continues to appreciate at a blistering pace.
Noah Kiedrowski
INO.com Contributor
Disclosure: The author holds shares in AAPL, AMZN, DIA, GOOGL, JPM, MSFT, QQQ, SPY and USO. However, he may engage in options trading in any of the underlying securities. The author has no business relationship with any companies mentioned in this article. He is not a professional financial advisor or tax professional. This article reflects his own opinions. This article is not intended to be a recommendation to buy or sell any stock or ETF mentioned. Kiedrowski is an individual investor who analyzes investment strategies and disseminates analyses. Kiedrowski encourages all investors to conduct their own research and due diligence prior to investing. Please feel free to comment and provide feedback, the author values all responses. The author is the founder of www.stockoptionsdad.com where options are a bet on where stocks won’t go, not where they will. Where high probability options trading for consistent income and risk mitigation thrives in both bull and bear markets. For more engaging, short duration options based content, visit stockoptionsdad’s YouTube channel.