Psychological Financial Fusion and The Dow Jones Transport Index

Today I asked the team from Psychology of the Call to open our eyes to an index that is often overlooked...or misunderstood as it relates to current or historic trends! I for one really didn't know too much about DJT and how it's been connected to our economic situation. Please enjoy the lesson and be sure and drop by Psychology Of The Call and tell them we sent you!

==================================================================

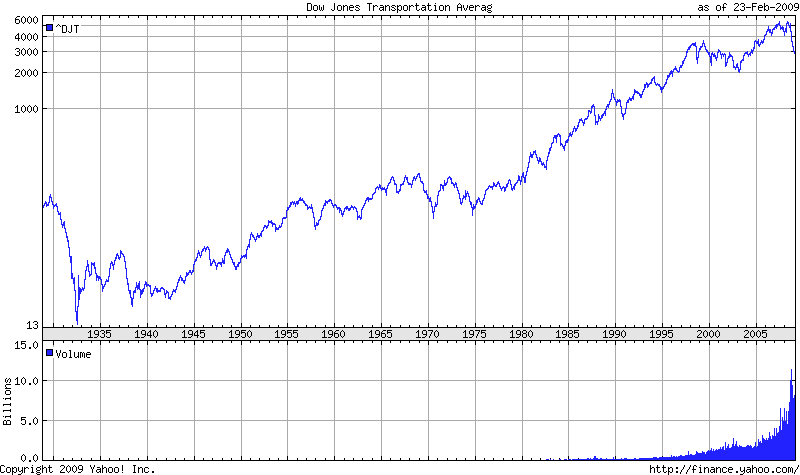
The Dow Jones Transportation (DJT) Index is a trusted leading economic indicator followed by wise men. The index was created by Mr. Charles Dow in 1884, a time when railroads were as important as today's internet superhighway, perhaps even more so. The index consisted of 11 stocks of which 9 were railroads, and all aboard have been derailed of late.

The deleveraging and divesting of every asset class in the cosmos has not been kind to the transport industry's equity holders, yet this sudden business shock may work to strengthen their business models as the world begins to dig itself out of this unprecedented trough.

Today's DJT is made up of 20 stocks of which only 4 are railroads: Burlington Northern (BNI), CSX Corp (CSX), Norfolk Southern (NSC), and Union Pacific (UNP). The other 16 stocks are airlines, trucking, and shipping.
http://en.wikipedia.org/wiki/Dow_Jones_Transportation_Average

Interestingly enough, today's talking heads insist on quoting the S&P 500 index as the best leading economic indicator, yet the DJT Index is 68 years its’ senior. That takes us back to just after President James A.. Garfield (R-20th) became the second U.S. President to be assassinated. The unfortunate event enabled Vice President Chester A. Arthur to take power.

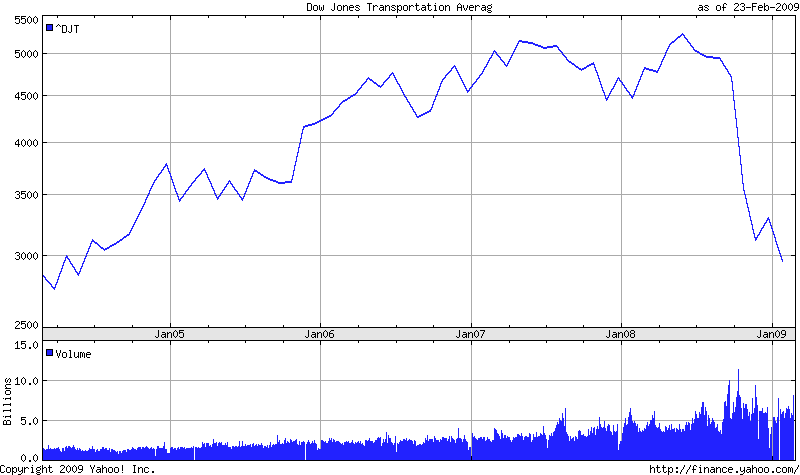
Here's a maximum time frame chart that doesn't even go back to its beginning in 1884:

Since corporate financial officers (CFO) are always striving to lower costs, many today would think their jobs have become easier since oil has fallen over $100/barrel, but that can't be further from the truth.

As CFOs experience this lower cost, the global economic slowdown is taking an even bigger toll on sales, share price, earnings per share, and margins. Profit margins at many of these companies are contracting due to desperate attempts to hedge what was a run-away oil market. Some airline CFOs stock piled crude supplies after it broke through $100/barrel, then $90/barrel, and so on. Thus the current price of sub $40/barrel has them miffed as global deleveraging is causing a domino effect of business contraction with the added burden of a higher crude cost supply glut in the short-term, yet not necessarily all are managed the same.

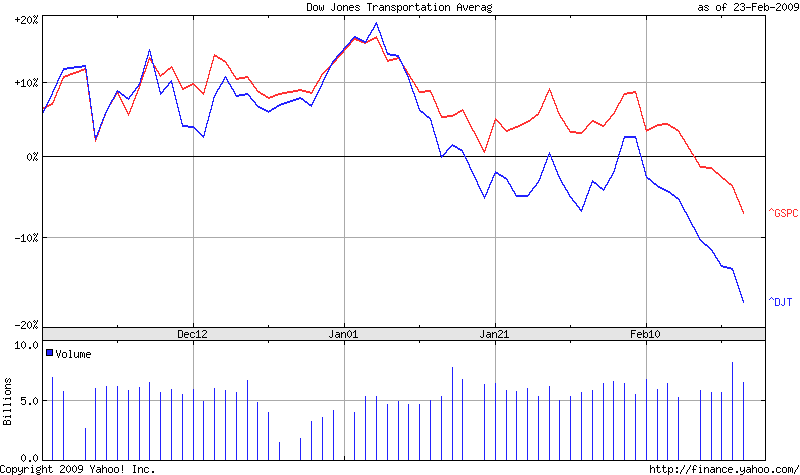
Even though the DJT's are a cyclical bunch, they usually signal an economic recovery before most other sectors since they must deliver raw materials from point A to point B. The raw materials are then utilized by manufacturers before eventually being sold at your Best Buy, WalMart, or Sears. The signals aren't looking too positive from a fundamental aspect of late since GDP and unemployment continue to suffer. The short-term technicals aren't giving us any bullish confirmations either. Notice  the DJT's dragging the S&P lower in this 3 month chart, foreshadowing a lower stock market ahead:

^GSPC = S&P 500
^DJT = Dow Jones Transportation Index

Since the DJT index is a corner stone of market history, forward-thinkers would be wise to follow it and use it in addition to the S&P when setting up pivot points for trades.

The financial sector is still a large weight inside the S&P index, and yet it hasn't dragged the S&P below the DJT in the last 3 months. The index is not signaling a sustained economic recovery anytime soon. The longer-term (5 year) chart reveals fairly solid footing in the 2,600 range, yet forward-thinkers respect the over-shoots that a climactic bottom prints.

While you can invest in thousands of stocks that are not directly part of the DJT, just about every stock you choose will be at the mercy of some transport cost(s). So please give some respect to the Dow Jones Transportation index; it has stood the test of the most powerful judge, Father Time. If you share our optimism in an eventual economic recovery, monitor this index in the next few days, weeks and months; it may help you profit.

Psychology Of The Call

Parabolic Trading System

Last week I invited Mark McRae from SureFireTradingChallenge.com, to come and break down support and resistance..and did he ever! Check it out HERE if you missed it. After the post went live we received a ton of feedback with regard to the post AND Mark's project, SureFireTradingChallenge.com, and all the feedback was positive!

So I wanted to give you the chance to learn from Mark again. This time I asked him to go into the Parabolic SAR and the trading system that goes with it. Adam is a HUGE fan of the SAR, as you know, and I think this post will help you see why Adam and Mark both use it. Don't forget to swing by SureFireTradingChallenge.com and give Mark your feedback there.

======================================================================

This particular technique has been around a long time and is still widely used by many analysts because of its adaptability to most markets.

History

The parabolic time/price system was first introduced by J. Welles Wilder Jr. in his book 'New Concepts In Technical Trading Systems'. It is very often referred to as the SAR system meaning stop and reverse. This means when a stop is hit the system reverses so it is permanently in the market.

The actual point at which the system is reversed is calculated on a daily basis (or whatever time period you are looking at) and the stop moved to create a new reverse point. The SAR point never backs up.

In other words if you are long the market the SAR point will increase every day. The same is true for short positions. This is the time part of the system.

The other important part of the system is the speed at which the SAR point moves. If the market is moving fast the SAR point will move slowly at first and then increase as the market moves higher, this is the price part of the system. The rate at which the system increases is called the acceleration factor.

It is beyond this lesson to give the exact calculation of the acceleration factor and it is not really necessary to know the formula as most charting services now incorporate the system in their indicator range.

Example of what SAR looks like.

My Use Of SAR

So far so good. The system is simple to trade and is very visual so it's easy to know when you should be short or long. If the SAR point (dots) are above the market you should be short and if they are below the market you should be long.

Here's the problem! It doesn't perform very well in the markets I have tested it on nor do I know any traders who trade it as a stand-alone system. Maybe in the markets of the past it would have worked well but not so now. The problem is there is just too much whipsaw.

Now you may be asking if there is too much whipsaw why mention the system at all? Good question and here are two reasons I find a good use for the system.

* The system can be very effective if a filter of some sort is used. In the example below of the eur/jpy I have used a MACD as a filter. If we were long the market then only long signals would be taken and the short signals ignored as long as the filter (MACD in this case) remains long. If a short signal is triggered but the filter still remains long you could close the position and wait for the next long signal. The reverse is true for short positions. You could use any oscillator you feel comfortable with or even trend lines.

* Sometimes it can be very difficult to find a good place to put your stop. With the SAR system you will always know exactly where to place a stop and it will increase everyday to help lock in profits. It also gives the move enough room for market corrections without taking you out of the position. I like this particular method if I have a long-term position which; I only want to check on once a day. I can quickly check how the position is and then move my stop accordingly.

I am sure you can find many other uses for the SAR system and its well worth playing around with the parameters to see if it can be added to your trading arsenal.

Good Trading

Mark McRae

==================================================================

Be sure and visit SureFireTradingChallenge.com to learn more about Mark and the contest!

Asian stock markets mostly higher on Citi report

By JEREMIAH MARQUEZ
AP Business Writer

(AP:HONG KONG) Asian stocks were mostly higher Monday, with Hong Kong and South Korea's benchmarks up more than 2 percent, amid reports the U.S. government might take a larger stake in troubled banking giant Citigroup to ease the financial crisis.

Worries that major Western banks, crippled by growing losses from bad assets, might have to be nationalized sent markets sharply lower last week.

But investors seemed relieved to have some clarity about the fate of Citigroup after the Wall Street Journal, citing people familiar with the situation, said late Sunday that Citigroup Inc. is negotiating with authorities to increase the U.S. government's stake in the teetering lender to as much as 40 percent.

Executives would prefer to keep the government's stake closer to 25 percent, according to the Journal, which reported Citigroup made the proposal to regulators.

So far, President Barack Obama's financial rescue plans have met a lukewarm reception. But analysts say such a move could help restore confidence by finally bring a measure of stability to the hard hit financial sector, further boosting the chances for an economic recovery.

"People are taking it as a positive sign," said Francis Lun, general manager of Fulbright Securities Ltd. "It shows the government will not allow a major bank to fail again. They've learned their lesson with Lehman Brothers that the ramifications are so great, sometimes no amount of money can rebuild confidence."

Hong Kong's Hang Seng rose 291.26, or 2.3 percent, to 12,990.43 and South Korea's Kospi was up 25.39, or 2.4 percent, at 1091.22.

In mainland China, the Shanghai benchmark added 0.4 percent. Markets in Taiwan and the Philippines also edged higher.

In Japan, the Nikkei 225 stock average lost 29.12 points, 0.4 percent, to 7,387.26 as the yen strengthened against the dollar, thought recouped some its losses. Australian shares also fell.

U.S. futures were higher on the Citigroup report, suggesting Wall Street would recover at the open. Dow futures rose 67 points, or 0.9 percent, to 7,419 and S&P500 futures were up 7.8 points, or 1 percent, at 777.30.

Last Friday, continuing financial and economic worries sent the Dow Industrials down 100.28 points, or 1.3 percent, to 7,365.67 On Thursday, the Dow broke through its Nov. 20 low of 7,552.29, and closed at its lowest level since Oct. 9, 2002.

The Standard & Poor's 500 index on Friday fell 8.89, or 1.14 percent, to 770.05.

Oil prices were steady in Asian trade, with light, sweet crude for April delivery up 35 cents at $40.38 barrel. The contract edged down 15 cents to settle at $40.03 Friday.

In currencies, the dollar fell to 92.85 yen from 93.32 yen, while the euro strengthened to $1.2913 from $1.2825.

Major indexes fall more than 6 percent for week

Major indexes fall more than 6 percent for week

NEW YORK (AP) — Wall Street ended another terrible week Friday, leaving major indexes down more than 6 percent as investors worried that the recession will persist for at least the rest of the year and that government intervention will do little to hasten a recovery.

Investors shaved 100 points off the Dow Jones industrial average just a day after the market's best-known indicator dropped to its lowest level since the depths of the last bear market, in 2002. Stocks of struggling financial companies were among the hardest hit.

The Standard & Poor's 500 index, the barometer most closely watched by market pros, came close to its lowest point in nearly 12 years.

"Right now, more than a crisis in mortgages or in housing, we have a crisis in confidence. That is biggest problem in trying to analyze the current market," said James Stack, president of market research firm InvesTech Research in Whitefish, Mont. "You cannot analyze psychology."

Wall Street has been sinking lower as investors come to terms with the fact that the optimism behind a late-2008 rally was clearly unfounded. Companies' forecasts for this year, on top of a dismal series of fourth-quarter earnings reports, pounded home the reality that no one can determine when the recession will end.

"It was a market that was built on that hope, and what we're seeing now is an unwinding of that," said Todd Salamone, director of trading and vice president of research at Schaeffer's Investment Research in Cincinnati, of the rally from late November to early January.

The disappointment seen this week arose from the market's growing recognition that the Obama administration's multibillion-dollar stimulus and bailout programs are unlikely to turn the economy around anytime soon.

"There were a lot of people that were banking on Washington to get us out of this. I don't know if there is anything Washington can do," Salamone said. He said the global economy is going through the tedious process of reducing borrowing and working through bad debt — something government help can't speed up.

With the week erasing whatever shreds of hope the market had, there is virtually no chance of a rally on Wall Street. What the market might see is a blip upward — but blips tend to evaporate quickly.

That's what happened Friday. Stocks erased some of their losses after White House press secretary Robert Gibbs doused fears that the government would nationalize crippled banks. Investors who worried about seeing their shares wiped out by a government takeover welcomed the news, but it didn't ease broader concerns about the economy.

The Dow Jones industrials briefly went into positive territory, but quickly turned down again.

Salamone said investors had been too hopeful in late 2008 and at the start of this year that the new administration would be able to swiftly disentangle the economy.

The Dow industrials fell 100.28 points, or 1.3 percent, to 7,365.67 after earlier falling more than 215 points. On Thursday, the Dow broke through its Nov. 20 low of 7,552.29, and closed at its lowest level since Oct. 9, 2002.

The Dow's 6.2 percent slide for the week was its worst performance since the week ended Oct. 10, when it lost 18.2 percent.

The Standard & Poor's 500 index on Friday fell 8.89, or 1.14 percent, to 770.05. The benchmark most watched by traders came within less than 2 points of its Nov. 20 close of 752.44, which was its lowest since April 1997. It remains above its Nov. 21 trading low of 741.02.

The Nasdaq composite index fell 1.59, or 0.11 percent, to 1,441.23.

For the week, the S&P fell 6.9 percent, while the Nasdaq lost 6.1 percent.

Declining issues outnumbered advancers by about 3 to 1 on the New York Stock Exchange, where consolidated volume came to a heavy 8.12 billion shares as options contracts expired. Volume on Thursday came to 5.64 billion shares.

The Russell 2000 index of smaller companies fell 5.75, or 1.4 percent, to 410.96.

Other world indicators also fell sharply. Britain's FTSE 100 declined 3.2 percent, Germany's DAX index tumbled 4.8 percent, and France's CAC-40 fell 4.3 percent.

Shares of financial bellwethers Citigroup Inc. and Bank of America Corp. fell on worries the government will have to take control of them. Citigroup tumbled 22 percent, while Bank of America fell 3.6 percent. The stocks were down as much as 36 percent during the session.

The fears about the banks are hurting shareholders of those companies and dragging down the rest of the market because the broader economy can't function properly when banks are unable to lend at more normal levels.

"Financing is the blood which runs through our nation's veins. It's what keeps us alive," said Lawrence Creatura, a portfolio manager at Federated Clover Investment Advisors.

He said the talk of nationalizing banks only underscores the troubles with the economy.

"Things are clearly not normal. It's not healthy. The patient was on life support, and now what we're talking about getting out the paddle with respect to nationalization," Creatura said.

As investors dropped out of stocks, safer investments like Treasury debt and gold rose. The price of the benchmark 10-year Treasury note rose sharply, sending its yield down to 2.79 percent from 2.86 percent. The yield on the three-month T-bill, considered one of the safest investments, fell to 0.26 percent from 0.30 percent late Thursday.

Gold broke above $1,000, closing at $1,002.20 an ounce on the New York Mercantile Exchange.

Investors are looking desperately at any safe havens simply because the stock market, which rises and falls on investors' expectations for the future, sees only trouble ahead.

"There's still a big fear factor syndrome," said Michael Strauss, chief economist and market strategist at Commonfund. "There is a focus on what is happening here and now instead of six months to nine months from now."

___

The Dow Jones industrial average closed the week down 484.74, or 6.2 percent, at 7,365.67. The Standard & Poor's 500 index fell 56.79, or 6.9 percent, to 770.05. The Nasdaq composite index fell 93.13, or 6.1 percent, closing at 1,441.23.

The Russell 2000 index, which tracks the performance of small company stocks, declined 37.40, or 8.3 percent, to 410.96.

The Dow Jones Wilshire 5000 Composite Index — a free-float weighted index that measures 5,000 U.S. based companies — ended at 7,802.27, down 583.47, or 6.96 percent, for the week. A year ago, the index was at 13,758.35.

Exact Swing Points -Support And Resistance

Today I'd like to welcome back Mark McRae from SureFireTradingChallenge.com. I personally have known Mark for over three years, with Adam knowing Mark well over 5, and Adam and I both agree that Mark is truly an innovator and one of the hardest working traders we know. His latest project, SureFireTradingChallenge.com, kept him holed up with charts and traders from all around the world to find some of the best methods in the world for trading. Check it out here.

Now his blog post today is more applicable now then it ever has been...support and resistance! Let me let Mark teach you a bit more:

=================================================================

Where exactly are the support and resistance points?
Where exactly are the swing points on a chart?
This is a particularly important lesson!
Just about every system or method of trading at least takes note of where the key support and resistance levels are.

I have found a double use for my method of identifying these points - They are also Swing Points!

You may think you know where Support and Resistance is, but do you really?

How do you know where support and resistance really is?

The problem with Support and Resistance (S&R) is that it is not a definite number. It is not an exact point on the chart at which price will, without any hesitation stop.

In fact S&R is actually an area - it is not an exact number as we would all like to think.

The dilemma of course, is that in order to do our calculations we need an exact point. You can't enter $50.10/20 area when using fibonacci or working out your stops and limits. You need an exact number even though S&R is not an exact number.

Try telling your broker that you want a stop loss at somewhere between 50 and 55 and watch him burst a blood vessel.

This is what I want to concentrate on in this lesson. This is a technique I have found to be particularly good at not only identifying strong S&R points but also swing points.

In order to find S&R we must first identify market swing points. There are various ways of doing this but I am going to use the one I have used for years.

For the purpose of swing points we are not interested in the open or close of the bars only the high and low.

Take any bar and think of that bar as the start bar (S). If there are two consecutive higher highs than the bar you marked (S) then that is a swing up e.g. bar (1) has a higher high than bar (S) and bar (2) has a higher high than bar (1). If there are not two higher highs than bar (S) then you move to the next bar and see if there are two consecutive higher highs.

This can be particularly useful if the market is trading sideways and you are trying to determine the breakout point. There may be many peaks and valleys but for me there is only one real point - that is the most recent swing up or swing down.

Look at the next diagram

You can see that although there were a few highs and lows that you could have taken as support or resistance, but it wasn't until bar (M) that a definite swing point had been identified and you could mark bar (K) with an (S).

Swing Down

To work out the swing down point - take any bar on a chart and think of that bar as your start point - bar (S). If the next two consecutive bars make lower lows than the previous bar then that is a swing down e.g. bar (1) has a lower low than bar (S) and bar (2) has a lower low then bar (1). If there are not two consecutive lower lows then it is not a swing point and you move to the next bar.

Just as in the example above you can see exactly the same thing with the swing down. Even though price made a few highs and lows it wasn't until bar (M) that you could mark bar (K) as the (S) point.

Support And Resistance

Only once we have clearly marker swing points can we go on to identify our support and resistance points.

As you can see from the chart I have marked all the swing up points and swing down points. When we are in a down trend then the swing down points act as resistance and when we are in an up trend the swing up points
act as support.

Marking the support and resistance points using this method of first identifying the swing points will give you definite points on a chart from which to calculate your stops, limits and projections.

Good Trading

Best Regards
Mark McRae

==================================================================

Please take some time to visit Mark and see his new project: SureFireTradingChallenge.com.