How Large is the US Federal Debt?

For today’s guest blog post I contacted Mike Hewitt from DollarDaze.org. He sent me an interesting article breaking down the enormity of the US Federal Debt. Enjoy this post. For more daily financial commentary from Mike be sure to visit DollarDaze.org

==================================================================

At the time of writing this article, the current US Federal Debt stands at $10.7 trillion. The sheer magnitude of that number is difficult to comprehend.

In order to illustrate just how large that number is, consider the following...

The size of a dollar bill is 6.6294 cm wide, by 15.5956 cm long, and 0.010922 cm in thickness. It would take approximately 96,721,648 dollar bills to make up one square kilometre.

The volume taken up by these dollar bills would be 12,068,253 cubic meters. This would fill over 90% of the largest building in the world, the Boeing Plant in Everett, Washington designed to assemble Boeing 747 planes.

If we were to cover an area with enough dollar bills equal to the current US debt it would have an area of 110,493 square kilometres which would nearly cover the entire state of Virginia!

When stacked, the number of dollar bills required to represent the US debt would be 1,167,243 km high. This is about 3 times the distance to the moon!

Laid end to end the dollar bills would measure 1,664,460,767 km which is longer than the distance of Saturn at its furthest point from the Sun. Uranus is 2.974 million kilometers away from the sun (about $19.1 trillion required).

Thought of in this context, we can truly say that the US debt is astronomical!

Best,

Mike Hewitt

==================================================================

Mike Hewitt is the editor of DollarDaze.org, a website pertaining to commentary on the instability of the global fiat monetary system and investment strategies on mining companies.

November Trader's Blog Contest Winner

There were 40 eligible entries from the November Trader’s Blog Contest. Thank you for everyone who participated. It was great to hear different experiences in your adventures in trading.

The lucky winner of 6 seminars from our INO TV digital library was comment number 28...

Brian L. of Lions Bay, British Columbia

Congrats Brian, your discs will be shipped out today. Don’t forget to enter our December Trader’s Blog Contest sponsored by INO TV, where the question is, “Will The 1st Trading Day of 2009 By Controlled By The Bears or The Bulls?" We've had a lot of responses, so jump on and give your two cents.

Best,

The INO TV Team

Using Option Spread to Reduce Risk

Happy Thanksgiving! I hope you spend this time with family and friends enjoying their company and eating delicious food! Today I've asked Behrouz Fallahi  from http://markettime.blogspot.com to come and keep us on the educational track and teach us a bit about how to use option spreads to reduce risk.

===================================================================

Many market participants are conditioned to think of options as instruments of gambling and undue risk. In my opinion options should be regarded as what they really are: instruments of market participation. Like any other tool, it is the way we use them that can make them help, or harm us.

I sometimes use options instead of buying or shorting the underlying securities. As we know, options come with an expiry date, and a time premium that shrinks ever so faster as we get closer to expiration. So, timing is important. Also, it is important that one chooses an expiry date that would give enough time for the trade to play out.

Following is a trade I did a while back using put spreads to short the Biotech Holders ETF (BBH). I will use a hypothetical position size of 10 contract for simplicity of calculations but that is not the size of the actual position that I had.

On August 14, 2008, a TV commentator's remark on the biotech sector being hot and attracting funds caught my attention. I am a strong believer that when I hear something on TV, the story has already run its course. Not that financial pundits mean to deceive us, just that they, or at least most of them, pay attention to things like most of the rest of us - well past the half way mark if they are half good at what they do, right at the end if they are not.

A look at the BBH chart got me interested on the short side.

I noticed a few things
1.    Price had a huge gap up in mid July
2.    It followed through by another, smaller gap up, which was quickly reversed by a gap down, forming an Island Reversal.
3.    The island reversal was ignored by bulls and price rose, but in a very tight slanted channel
4.    The latest rise on the chart was accompanied by diminishing momentum, and volume
I liked what I saw for a short and decided to keep an eye on it.

My first thought was to see if I could find a leveraged short ETF on the Biotech sector. I could not find any. I am a member of a very active community of traders. I posted a question to see if anyone would aware of a Biotech short ETF. Instead of a simple Yes/No answer, I received detailed dissertations why it would be a bad idea to short Biotechs. This was my second contrary confirmation that I had a good shot on the short side. Not having been able to find an ETF to do the short, I decided to use put options.

A few days later, I got what I wanted

1.    The rising channel broke
2.    Stochastics gave a sell signal
3.    Negative momentum divergences in place
4.    Longer term momentum, at the top of the chart, showed signs of rolling over
Things are seldom perfect
1.    Volume was lacking
2.    price was on a first run out of a long term base indicating possibility of a mere pullback and not a total breakdown
3.    Longer term MAs were pointing up
I decided to go on with the trade and buy some puts on BBH. But what puts? To decide on a strike, I first tried to come up with some target areas if the short would actually work.
1.    There was the huge gap in  183-190 area
2.    There was the top of rectangular base at 180 (that base had been 2+ years in the making)
3.    50% retracement of the up move sat right on the resistance line at 180
4.    32% retracement of the up move was somewhere in the  183-190 gap
I thought if I could get lucky, 180-185 area might define a drop target.

What option duration? Trying to give the trade a bit of time, I decided to buy Oct 185 puts. Before placing an order I defined on my exit rules:
1.    Buy, sell, stop decisions were to be primarily taken based on price action of the underlying security and not the option price
2.    If options were more than 1/3 in loss, the position would be closed.
For 10 Oct 185 puts at 1.25, I would have to pay 125 dollars a contract or 1250 dollars total. That would be all I could ever lose; if I could get to exercise my rules, I would actually lose 1/3 of that.

It so happened that the channel break signal that I took was a good one, and BBH started on its merry way down, all the way to this chart of Sep 4, 2008

The puts that I had could now be sold for 2.20 for a net profit of 220 - 125 = 95 dollars a contract or 95 / 125 = 76%.

But, conservative and risk averse as I am, I still am a greedy trader. This chart looked like it was rolling over on a weekly basis. So I decided to do something different.
1.    I would sell 30% of the position and take some profit
2.    I would lay a spread against the remaining 70%
I could sell 3 of my puts for 3 * 2.20 = 660 dollars, bringing my cost down to 1250 - 660 = 590 dollars for remaining 7 contracts = 90.7 dollars per contract.

I could now sell 7 Oct 180 puts for 1.25 or 125 dollars a contract = 7 * 1.25 = 875 dollars.
So I would be out 1250 - 660 = 590 dollars on 7 Oct 185 puts

I would get 7 * 125 = 875 dollars from the sell of the Oct 180 puts.

That would give me a net profit of 875 - 590 = 285 dollars, or 285 / 1250 (original investment) = 22%

Not as good as 70% but still decent, and I was still in the game, free of cost.

So what could happen from then till Oct expiration day if I did nothing?
1.    BBH could stay above 185, and all puts would expire useless. Then I would make 22%
2.    BBH could drop below 180, then I would be put BBH shares at 180, which I would sell at 185 using my higher puts and would make 500 dollars a contract on top of what I had already made (best possible outcome)
3.    BBH could stay between 180 and 185 at price x, then 180 puts would expire, and my 185 puts would be worth (185 – x) * 100 dollars per contract + what I had already made
4.    A disaster could happen and all contracts could be declared void, I would still make 22%, that is, if the disaster did not adversely affect my bank.
This is a recent chart of BBH showing what would happen if I had, against all technical signs, followed the pundit on TV, or the traders on the board I mentioned above.

A combination of basic chart reading techniques, decent timing, and risk management using options can produce good returns against well-defined, limited risk.

About the author:
Behrouz Fallahi is an independent market participant who keeps an active blog at http://markettime.blogspot.com.

Clean Tech: Complex Field, Simple Story

I'd like everyone to welcome back John Rubino from DollarCollapse.com. I've been a visitor to his site for a while now and it's become clear that he's passionate and knowledgeable about the subject of Clean Tech. So read his article below and ask him any questions you may have. Oh, be sure and check out his book, it's a must read!

===================================================================

Imagine, for a minute, that you’re Barack Obama. You’ve just spent two years running a non-stop, highly-successful presidential campaign. Now, when a normal person would be expect a well-deserved  month on some quiet beach, the world is clamoring for a plan to stop the global economy from imploding. You’re not even moved into the White House and the weight of the world is on your shoulders.

Luckily, in formulating your plan you have a couple of advantages. First, with the federal deficit already projected to top $1 trillion in 2009, no one could care less if your proposals are expensive. Conventional wisdom says they SHOULD be expensive because government spending is the only thing with a positive arc these days. So you’re free to indulge your inner FDR and talk about a “New, New Deal” without fear of right wing ridicule. Second, a new generation of clean technologies is just now coming to market with the potential to solve some festering problems. Solar, wind, smart grid and the rest can replace foreign oil with locally produced (or conserved, same thing) power. They create jobs in the U.S., while depriving rouge oil producers like Russia and Venezuela of the means to make trouble. And they potentially fix global warming.

So your grand economic plan turns out to be something you can sketch out on a napkin: Borrow trillions of dollars and invest it in clean tech. You get jobs, geopolitical advantage, a cleaner environment, and an aura of supreme coolness, all with the stroke of a pen. And that’s exactly what soon-to-be president Obama announced last week, to the apparent joy of the markets: Friday and Monday saw the biggest two-day pop since 1987.
For investors, this sudden clarity in the financial landscape comes at an extraordinarily good time, since clean tech stocks have been absolutely whacked in the general bear market. They’ve popped a bit lately but for the most part are still down more than half from their oil-crisis euphoria highs. They are, in short, an investment thesis with both short and long term appeal. What they’re not is simple. This sector contains many different industries with radically different prospects. Some work today, some will work in a couple of years, and some will never work. So even with a nice stiff government spending tailwind, some clean technologies are more timely than others. Here are three to get you started:

Solar
Over the past decade solar cell efficiency (i.e. their ability to turn a given amount of light into electricity) has risen steadily while production costs have fallen. Now the best solar panels, when bolted onto an Arizona or California roof, generate power that’s competitive with the cost of electricity delivered from distant coal fired plants. This "grid parity" will make solar an attractive addition to most sunny-clime homes and businesses over the coming decade, giving the industry all-but-guaranteed double-digit growth. The question for investors is how to play the bleeding edge boom/bust cycle: During the recent oil crisis, solar power demand soared, causing a shortage of polysilicon, the industry’s main raw material. So everyone with any connection to the business built a polysilicon plant, and now there’s a glut. This is sending prices down, which is good for the solar cell makers. At the same time, the credit crunch is slowing demand growth for solar, which will cause a lot of marginal players to fail. AND several new versions of “thin film” solar are hitting the market, with potentially decisive advantages over traditional silicon. It’s messy to say the least. So…buy the leaders, which have strong balances sheets and in-demand technology. That would be First Solar (FSLR), Energy Conversion Devices (ENER), and SunPower (SPWRA), all of which trade on U.S. exchanges, and Q-Cells, which trades on the Frankfurt exchange as QCEG.

Wind
Wind turbines have gotten so big and so efficient that they’re competitive with utility scale coal and gas fired plants. Wind farms are going up all over the world, onshore and off, and by-and-large the technology is living up to its billing. The credit crunch is causing some projects to be cancelled, but since the makers of turbines and related gear were facing three-year backlogs at the height of last year’s mania, a slowdown will have little effect, other than to shorten the backlog. The major wind companies will, as a result, continue to generate 25% or so annual growth. Most of the major turbine makers are headquartered in Europe and trade on foreign exchanges. Among them: Vestas Wind Systems (VWE.CO -- Copenhagen), Suzlon Energy (SUZL -- Bombay) and Hansen Transmissions (HSNT -- London).

Smart Grid
One of the Obama plan’s goals is to upgrade today’s aging electrical grid by installing high-capacity lines to ship power from wind farms to cities and adding gear to homes and businesses that let utilities and their customers manage and conserve power. This is known as the smart grid, and the opportunities are absolutely huge, since we’re starting with a really dumb grid. Some leaders in this field: Itron (ITRI), Echelon (ELON), American Superconductor (AMSC).

For Future Reference
Other clean technologies like biofuels, electric cars, and fuel cells are a bit further from the market right now. So don’t allocate much capital to them in the short run, but do follow their progress. Sometime in the next few years amazing news will start to filter out of these niches, both of game-changing technical results and promising stocks.

John Rubino

DollarCollapse.com

The Art of Contrarian Investing: Going Against the Crowd for Profit

I think with all the shorting going on, and the group that says "Ford can't possibly go much lower...I'm buying some", we all need to think about the contrarian point of view. For some of us that might be finally biting the bullet and saying "YES the economy is in trouble...I'm shorting!" Yet for others they think, "no chance the Dow continues to bomb like this, Obama will change the economy." Whatever your position, you need to understand exactly what goes into the contrarian mindset and I've asked Jon Lee from WeeklyTA.com to come and enlighten us a bit!

==============================================================

A contrarian believes that certain crowd behavior among investors can lead to exploitable mispricings in securities markets. For example, widespread pessimism about a stock can drive a price so low that it overstates the company's risks, and understates its prospects for returning to profitability. Identifying and purchasing such distressed stocks, and selling them after the company recovers, can lead to above-average gains. Conversely, widespread optimism can result in unjustifiably high valuations that will eventually lead to drops, when those high expectations don't pan out. Avoiding investments in over-hyped investments reduces the risk of such drops. – Wikipedia

Professionals vs. Non-professionals

"Whenever you find yourself on the side of the majority, it's time to pause and reflect."
– Mark Twain

What is the “Crowd”? They are the group of non-performing institutions, individual investors, traders, speculators, and other players in any market that form a collective opinion that is expressed in the terms of a degree of optimism or pessimism. We will call them the non-professionals.

The professionals are the “smart money”. These are the very few  that are aware of crowd behavior and are able to adjust their strategies (long and short) to profit from extreme sentiment. Note: professional does not mean institution by definition. Most institutions are part of the crowd.

The key point to make is that when non-professionals display an excessive amount of optimism or pessimism, the professionals enter into the market and drive prices in the opposite position. Any truly non-professional, one-sided opinion or expectation of a market will be unable to anticipate a movement created by the professionals in the opposite direction that is anticipated by the group of non-professionals. This is contrarian investing, going against the masses that believe in only one direction of a market and taking advantage of their unanimous opinion by crushing them on the other side.

Here’s a diagram I created to illustrate the above point:

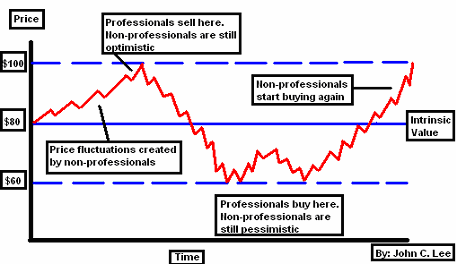
How does this work? Some might argue that if everyone’s buying and extremely positive, then why would the market crash? The answer: as more and more investors buy, the market will become fully invested. The last ones buying are the ones that bought into the market when the professionals were selling and will be stuck because of this overhead limit. After everyone’s bought, there won’t be anyone left to sustain the buying. Therefore, a fearful panic ensues and the masses start to sell, most of the times much later than they should have done.

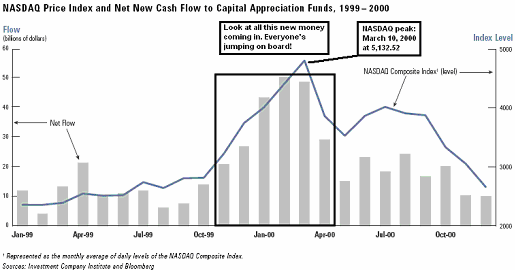
A recent example of massive cash inflow (totaling hundreds of billions of dollars) is shown below. Note that the peak of the NASDAQ was on March 10, 2000 at 5,132.52 at nearly the same time when the largest monthly in flow occurred. Clearly, everyone was invested at the full limit.

The Media’s Portrayal of “Professionals”: An Observation in Barron’s April 28th Issue

This is the “Back in the Pool” issue with the funny-looking bull cartoon testing out the pool’s temperature. Barron’s surveyed “professional” investors and here were some “crowd-like” results:

1) Describe your investment outlook through December 2008:
•    Very Bullish: 7%
•    Bullish: 43%
•    Neutral: 38%
•    Bearish: 12%
•    Very Bearish: 0%!!!

2) Is the U.S. stock market overvalued, undervalued, or fairly valued at current levels?
•    Overvalued: 10%
•    Undervalued: 55%!!!
•    Fairly valued: 35%

These questions were the biggest eye-poppers:

3) Are you beating the S&P this year professionally?
•    Yes: 74%!!!
•    No: 22%

4) Personally?
•    Yes: 72%!!!
•    No: 19%

Here's the most recent chart of the S&P 500:

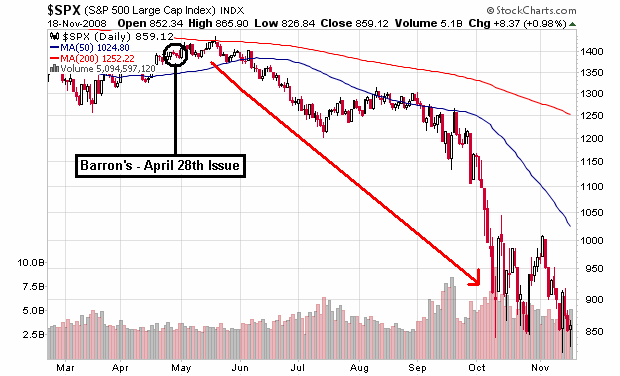
The media’s definition of “professional” is not always correct so please be aware of the difference. The market is down over 40% year-to-date, so obviously the results have now changed dramatically.

Contrarian Strategies

"The fastest way to succeed is to look as if you're playing by somebody else's rules, while quietly playing by your own.” – Michael Konda

•    Buy when media headlines read the absolute worst and there is no sentiment divide among investors. Once sentiment becomes entirely pessimistic, buy. Also look out for a bottoming of new capital in flows into stocks. Historically, the good time to buy was when capital in flows were between 10 -15%.
•    Sell when everyone is overly bullish and capital in flows into common stock & mutual funds reach a high. (In 1960 the market declined 18%, in 1962 -29%, in 1966 -27%, and in 1968 -37%, while stock ownership levels were between 32- 34%, the highest ever. In 1999-2000, stock ownership levels were at 31-33%, near an all time-high)
•    Don’t fight the trend. If the primary trend is down, go short. If the primary trend is up, go long. Why fight the long-term direction of the market?
•    Watch financial networks and read newspapers and magazines to get an idea of where sentiment levels are. Magazine covers are my favorite.

Conclusion

“Follow the path of the unsafe, independent thinker. Expose your ideas to the dangers of controversy. Speak your mind and fear less the label of 'crackpot' than the stigma of conformity. And on issues that seem important to you, stand up and be counted at any cost.” – Thomas Watson

It’s safe to say that following the real professionals is the way to go. In order to do that, you have to know how they play. There are three points that I stress: 1) there is tremendous pressure and influence to join the crowd and gain easy acceptance, 2) the crowd is wrong the majority of the time, 3) under duress, psychologically, our emotions and objectivity can become distorted and cause us to rationalize (a dominant coping mechanism) or deny (a dominant defensive mechanism) even the basic realities of truth.

Investors will be able to join the crowd when appropriate, but remain flexible to leave the crowd at times when the market warns us. I encourage each investor to respect the nature of human weakness and to become a free-spirited independent thinker.

Jon Lee

WeeklyTA.com