Tape Reading

For today's guest blog post, I've asked Kunal Vakil from MySMP.com to come back and teach us a bit about Tape Reading.

===================================================================

By Kunal Vakil, co-founder of http://www.mysmp.com/

08/12/2008

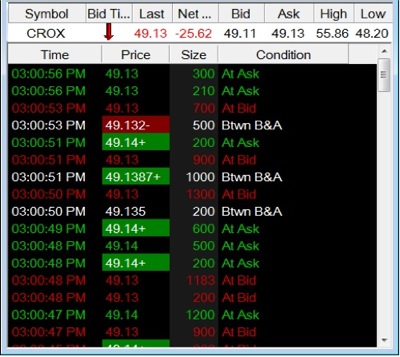
What is the Time and Sales Window?

From my experience in day trading over the last few years, my most valuable tool became the time and sales window, aka. the "Tape". The time and sales window basically shows the trader detailed information regarding the order flow for a particular security. The time and sales window provides details on each of the trades that have gone through for that security, such as: Time of Trade, Price, Size of order, and condition of order. Depending on the trading platform, you will have other data points available to you.

After mastering the message of the tape, you will be able to accurately decide when to enter and exit a trade.

How do I get access to the Time and Sales Window?

There are few brokers in the marketplace that offer the time and sales window to their customers. Typically, only trading platforms which are suited for day traders offer this option. I use Tradestation and as you can see in the image above, provides all the key elements that will allow one to effectively read the tape.

How to Use the Time and Sales Window

I am a very big believer that there are two truths in trading stocks. One is price and the other is volume. Tape reading involves both; and if used correctly, dramatically increases the odds of your trading working out. It does so due to the fact that your goal with tape reading is to follow the money.

While some professional traders may not like to admit it, trading stocks is an odds game. Your job as a trader is to put trades on with the highest odds of winning. Trading with the tape requires trading with patience. You cannot go out and buy or short a stock because you see the tape speeding up a bit. You need to be aware of support and resistance levels and also combine the message of the tape with price pattern formations.

Tape reading can be very fast and confusing at times and requires quite a bit of practice in order to get used to understanding the true meaning behind what you are seeing. Remember, every stock is a different story and tends to trade differently. It is wise to review the way in which the "tape" trades for a couple of minutes before entering a trade. Reading the tape requires you to train your eyes to scan for changes in character. I want to discuss a few of these key changes that you should take note of:

Size of Orders

Lets start with size. The size of the orders coming through will help you decide if there is conviction behind the price action you are seeing. When putting on a trade, you typically want to see a flurry of buy or sell orders which have greater than 300 to 400 shares in size. There is no hard and fast rule about this; it is more of a visual cue that your eye gets trained to recognize. Many times, I will see great technical setups in stocks that trade low volume. I stay away from these setups as the message of the tape is not as clear and this lowers my odds of a winning trade.

Order Speed

The speed of the orders is another key component to the message that the tape is giving you. Typically, when stocks breakout through support or resistance levels, not only will the size of the orders go higher but you will see the tape start to speed up. This gives you an indication that there is an interest in this stock at this level and that the interest is larger than a couple small traders buying or selling.

Order Condition

Order condition refers to which side of the bid/ask spread the trade was executed on. When we go long a stock, we want to see many orders being executed at ASK. Conversely, when we go short, we want to see orders being filled at BID. This gives us a clue as how desperate traders are to get into our out of this stock.

Speaking from Experience...

Above, I have reviewed a few basic principles of tape reading but I want to discuss some of lessons I have learned throughout my years of trading that I think you will find helpful when analyzing the tape.

Which stocks are best to trade?

I have received this question many times. The answer to this question for me is simple, I only trade the most volatile stocks of the day. These stocks are the ones which will provide you with strong volume and large interest from the public. They also provide strong and fast moves which you can make larger profits from. Remember, we need to see speed in the tape and that requires a stock with public interest.

Does the tape work better during specific times of the day?

In my experience, the answer to this question is YES. I typically only trade the first 2 hours of the day. This is when the most volatility is present in the market and also when most of the trending moves are made. Typically, lunchtime becomes very choppy and has a different group of traders who are buying or selling for different reasons than the first hour. I am not ruling out trading after lunchtime, however, my results have been less than stellar when I attempted to do so.

Tape Reading with Level 2

The level 2 window provides the trader with an edge. It will show you the sizes of the orders in the market makers book. While the market makers can play games with the level 2 in order to fool traders, in general you want to see high bid sizes and low ask sizes when you go long. On the flip side, you want to see low bid sizes and high ask sizes when you go short or sell out of a stock. Again, its not foolproof but it adds to the odds of your trading winning.

Exiting a trade

This is probably the most difficult part of the trade for most traders. Tape reading helps me get out of the trade by looking for imbalances. When I see a stock moving sharply in one direction, I will immediately look to the tape to offer clues as to when the brake pads will be applied. Again, this skill will take practice to develop. If your short a stock, keep an eye out for the bid side getting heavy and the bid/ask spread widening. This could be a tell tale sign that the juice has been used up.

Bid/Ask Spread at Key Levels

Make sure that stock does not have large bid/ask spreads as it approaches your entry points. You will not have much time to place you trade and if you are trading a volatile stock, you most likely will have to execute the orders at market. Large spreads tell me two things; first, your risk increases significantly when the spread increases. Why? Because most times you will have trouble getting out of a stock with a large spread using limit orders and this can turn a small loss into a big one quite quickly. Secondly, it tells me that there is not that much interest in the stock. If there was, the spreads would narrow and both sides would come as close as possible.

Extremely High Volume Stocks

There is trading high volume and then there is trading extremely high volume. I try and stay away from stocks that trade, for example, 30 or 40 million shares as the message of their tapes can be a bit confusing at times if your a beginner. You may see 14 orders come through at bid with large sizes but that may not mean as much as if the stock was trading less volume. Remember to always keep everything in context. If your stock trades gigantic volume, you should expect a different kind of tape action.

Make price prove the point

Up to this point, we have discussed order size, speed, and condition. While these are all key components of the tape, you must let price prove the point. For example, if you are looking to short a stock at $54 and there is strong order flow selling at bid at that level, my experience has shown me to wait for that level to break. If it does not, you may be involved in a trap that was made to get the weak traders out and then take the stock in the opposite direction.

Don't let your ego get in your way

One of the biggest mistakes that I see many traders making is that they get attached to their positions. In an effort to appease their ego's, they tend to take a trade and stick with it until they are right. Remember, day trading is an extremely fast game and if you do not react with speed, you will be left in the dust. When you make a decision based on that tape action and the stock does not go in your favor relatively quickly, odds are that you are in a bad trade.

Focus

It is extremely important to have utmost focus when you are trading and trying to listen to the message that tape is giving you. Try and stay in a zone and filter out the extra noise. If you are going to put a trade on, be in that trade and nothing else. This will help you feel when it is right to stay in the stock and when its time to get out.

Conclusion

Tape reading is a very important skill to have as a short term trader and can keep you out of many bad trades. Remember, don't be an action junkie, psyching yourself up for every trade. If you do this, you will find a reason to put on bad trades in the heat of the moment. Discipline is key and it takes time to develop. For any new traders looking to try this out, please practice, practice, practice before you put your hard earned money at work. Mastering the art of tape reading will take time, but when you do, you will be rewarded.

Finding Your OWN Stocks

Today I'm pleased to introduce The Wild Investor from...The Wild Investor.com! I've had the chance over the past few weeks to spend some time at his site, seeing his methods, and really gleaning a lot of good info. His post today covers something we can ALL benefit from. Enjoy.

====================================================================

A couple years back, I got my first break into the world of trading stocks by listening to Jim Cramer of Mad Money. My first couple of trades came through his recommendations; however, that seemed to die out pretty quickly. He covers so many stocks at one time, that it seems he is proven wrong more often than right. If I was ever going to make some real money in the markets, I would have to branch out on my own.

Tons of people know how to buy, sell, see if a stock is worth acting on, and so on, but very few actually know how to find stocks.

Let me clarify. Perhaps some article talked about the 10 stocks you have to buy in 2008. Many can probably pick and choose the best ones out of those 10, but without that article they probably could have never come up with a list of 10 stocks.

So how do you go about finding stocks to invest in? You can't always rely on some third party.

Many people enjoy the ease of scans, but the tools and resources may not be available to everybody or they may just not understand enough to perform one.

Below are some steps that can help you create your own manual scan and perhaps help you run an automatic scan sometime in the future.

1. Reflect

Create a list of the past stocks you have either traded, watched, followed, or whatever. Try to get at least 50 stocks (100 if you are an overachiever). One by one, see which ones were successful, which failed, why they moved the way they did, and how you gained interest in that stock.

2. Breakdown

Try to group the stocks in the different ways your broke them down. For example, perhaps you have a few stocks that were successful on a cross of the 200 day moving average. Maybe some were oversold. Whatever it may be, just try and group some stocks together.

3. Classify Each Group

Out of the different categories you have created, come up with some sort of criteria that fits each stock in the group. For instance, say I have Stock A and Stock B in one group. Go back before those stocks experienced their gain and create some sort of pattern that could have been used to predict those gains.

4. Trial and Error

After you have gone through all your different groups, it is time to test. The more test you run, the better chance you have of creating a profitable search. Run your test on all the different stocks on your list, and see what results you get. Choose other random stocks that might match your criteria. Tweak it if you need to because the goal is to try and perfect your criteria, so that it should work more often than not.

5. Practice Run

Most likely you want to see if your system works before you throw real money at it, so find some stocks that fit your criteria. Use your finance site of choice and find top movers, similar stocks to the ones that were already successful, or look in the sector you are comfortable in and just let your system run. Follow the stocks until your system said it should have worked and look at the results.

Did it work? Keep trying and editing until you are comfortable throwing real money at it. It may seem tedious and cumbersome, but hopefully you will be able to move out of the realm of Jim Cramer and into your own world.

For those that still may be confused, here is a simplified version of my criteria:

  • Consistency to perform within 6 months or less

  • Ability to diversify and maintain some form of global exposure

  • Companies that have been oversold or beaten down

  • Buy and sell signals according to technical analysis

  • Best of breeds that continually produce and post solid numbers

  • Capability to shine in any type of market condition (recession proof)

In the end, the goal is to create a simplified way to complete a somewhat complicated task. If you can ease your tasks and rest your mind, then it only betters your trading, which increases your profits.

The Wild Investor

The 4 Characteristics of Strong Breakouts

For today's Guest Blog post, I've asked Harry Boxer to come and teach us a little bit about what makes a breakout a STRONG breakout...and MUCH more! Harry's been a contributor on CNBC, CBSMarketWatch, WinningonWallStreet, Stockhouse, DecisionPoint and more. If you're eager to learn more about Harry Boxer and his methods, check out TheTechTrader. Enjoy the post.

===================================================================

Breakouts of long bases on strong volume are frequent harbingers of continued price appreciation. Another harbinger, after the initial up-leg, is a low-volume, orderly pullback towards support.

An analysis of the Converted Organics (COIN) chart illustrates this strategy. As the daily chart indicates, COIN in October 2007 broke out of a base pattern that extended back since its IPO in late February. Some traders who missed entering early may have given up on the stock when it rose 50% from around 2 1/2 to 3 3/4, but a closer look at the chart shows why it had more room to move.

COIN's pullbacks were orderly, coming on lower volume and holding near its moving averages, a key sign of more upside to come. Not once did its pullback break beneath the 40-day moving average, and most pullbacks hugged the 21-day moving average.

The pattern was breakout (mid-October), flag, breakout (early November), flag, breakout (late December), flag, and then breakout in mid-January, where it closed on January 15 at 12.58, more than 5 times its pre-October breakout price. Volume on each pullback was a small fraction of the level of the breakout, and a shallow decline just grazing the moving averages suggested a continuation of the uptrend.

As a stock in a rising pattern pulls back, look for several factors to portend the continuation of the pattern.

1. First, look for very low volume on the pullback between 10% and 25% of the average volume of the last 90 days. Second, watch for the decline to flatten near the 21- or 40-day moving average on the hourly charts in a quiet, narrow flag-type formation.

2. When the breakout comes, buy on the initial thrust out of this flag pattern. This means a sudden dramatic change in price accompanied by heavy volume. The price doesn't necessarily have to rise above the top of the flagpole (i.e., the previous rally high prior to the consolidation), but only needs to be a price bar that is at least several times the size of the previous several bars on the chart.

3. Wait to add to the position until the stock takes out the top of the flagpole, which is key short-term resistance. This will protect against a head fake, which is a move that starts out dramatically but quickly fizzles price- and volume-wise after just a bar or two and has no follow-through and, in particular, does not make it through the top of the flagpole.

4. Set a stop below the bottom of the lowest level reached during formation of the consolidation or flag pattern out of which it has broken. When COIN, for example, in its November upmove exceeded the top of its October flagpole around 3.75, that was one signal to get in or add to the position. Another signal came in the second week of January at around the 8 level, when we first highlighted it for our subscribers.

We saw COIN having consolidated and tested its 8.70 triple-top resistance over the previous 3-4 sessions, and noted that if it broke through that level it could initially head to 10 1/2-11, and then beyond that to our next target of 12 1/2-13, where it last resided, as mentioned, on January 15. The COIN example illustrates the potential that chart patterns like high-volume breakouts from long bases and low-volume flags can have in predicting price appreciation.

Harry Boxer is an award-winning, widely syndicated technical analyst and author of The Technical Trader, which features a real-time diary of Harry's minute-by-minute trades and market insights, plus annotated technical charts & stock picks, based on Harry's 35 years experience as a Wall Street technical analyst. You can find out more about Harry's work at TheTechTrader.com.

Gold ends down but off 5-wk lows, eyes US data

By Frank Tang & Jon Harvey

NEW YORK/LONDON (Reuters) - Gold ended 1 percent lower on Wednesday as the dollar climbed, oil prices feel and U.S. stocks rose, denting the precious metal's appeal.

Gold was at 918.80/920.30 by New York's last quote at 2:15 p.m. EDT, down from $928.45/929.65 late in New York on Monday.

Gold's decline was "pretty much forex related, and oil is coming down," said senior Commerzbank trader Michael Kempinski. "We need to see come stronger commodities in general, and a stronger euro, to push gold higher again."

The dollar rose to its highest level in a month against major currencies, pressuring bullion prices. Gold tends to move in the opposite direction of the U.S. currency, as it is often bought as an alternative investment.

Declining oil prices also dragged gold, as signs of weakening demand for crude and a rising dollar outweighed the supply threat linked to tensions in Iran and Nigeria. U.S. crude futures ended $2.54 lower at $122.19 a barrel.

Gold also dipped as U.S. stocks ticked up, dampening interest in the precious metal as an alternative investment.

"When crude oil goes down, gold also goes down with the stock market going up. Everyone is watching that correlation," said Adam Hewison, president of MarketClub.com in Annapolis, Maryland.

Hewison said gold should find support at current levels, but the $905 to $912 an ounce area represented a key support area. Should bullion fail to hold there, prices could test the lows set in June below $860 an ounce, he said.

Absent significant moves in oil and the dollar, gold prices should remain rangebound, analysts said, with physical buying muted during the low-demand summer season and exchange-traded funds' holdings steadying after recent gains.

U.S. gold futures for August delivery settled down $11.20, or 1.2 percent, at $916.50 an once on the COMEX division of New York Mercantile Exchange.

Gold traders awaited release of U.S. economic data this week, including GDP numbers on Thursday and nonfarm payross, construction spending and auto sales data on Friday. These reports could have a significant impact on the dollar.

Traders also looked ahead to Wednesday's oil inventory data from the U.S. Department of Energy.

"The consensus is looking for another drop of crude oil inventories, which might provide some support for crude oil and thus also for gold," said Dresdner Kleinwort analyst Peter Fertig.

Among other precious metals, spot platinum hit its highest level in almost a week at $1,775 an ounce, then retreated to end at $1739.00, down from $1,739.00/1,759.00, down from $1,763.00/1,783.00 late in New York on Monday.

Spot palladium was at $380.50/388.50, unchanged from late in New York on Monday. Silver fell to $17.35/17.41 an ounce from $17.46/17.52 late in New York on Monday.

---

See original Reuter's article here: http://www.guardian.co.uk/business/feedarticle/7690017

Straddling Options

The post below is from Eric at The Stock Market Prognosticator. Free free to leave a comment or let him know if you have any other option tips you would like him to write about.

---

It is important for investors not panic during the current market volatility. Money can be made on both the upside and downside. One of the strategies I employed recently involves using options to take advantage of this volatility. During the month of July, I opened "straddle" positions on six different stocks and ETF's. I closed all of them out at a profit within two weeks.

So here is how it works, a straddle is the simultaneous purchase of an equal number of both calls and puts on the same underling stock, ETF, or index. Both the calls and the puts should have the same strike price and same expiration.

What I am looking for is a large move by the stock before the options expires. I am indifferent as to which way the market moves, as long as the combined premium when I close it out is more than the combined premium that I paid.

Here are some other things to know:

1) Make sure that the options have several weeks to expiration so there is time for the underlying instrument to move.

2) Pick only options with large volume and narrow spreads, a few pennies per contract is best.

3) Be careful about using this strategy when the underlying instrument has very high-implied volatility, as all other things being equal, a high implied volatility leads to a higher option premium. If this implied volatility suddenly dissipates then one side of your position may drop sharply in price.

4) I usually wait until the underlying instrument is trading right at the strike price, so the options cast per contract is roughly the same.

Here is an example of one of my trades:

I purchased the Financial Select Sector SPDR (XLF) July 21 Calls and July 21 Puts at a price per contract of $1.14 and $1.13 respectively. This position was opened prior to the huge rally in financials last week. Four days later I closed the position out, selling the calls at $2.28 and the puts at $0.51 per contract. The profit before commissions per contract was $0.53, or $53.00. So a round lot of 100 contracts would have yielded a profit of $5,273 in less than a week.

Investing in options carries a lot of risk, so please decide yourself whether a strategy like this is correct for you as an investor.

---

If you would like to learn more about my investment philosophy, then please visit The Stock Market Prognosticator.