In-Depth Analysis: Halliburton Company (NYSE:HAL)

Today, I am going to be analyzing the stock of Halliburton Company (NYSE:HAL). On January 27th, a new red monthly Trade Triangle appeared, the first in 12 months for the stock. This indicates a significant technical development and changes the outlook and direction of Halliburton.

Today's in-depth analysis is not to say the stock is going to collapse and go out of business, but rather I am noting a confluence of certain technical indicators that do not paint a positive picture for this stock.

There is an old adage in trading and it says "they slide faster than they glide." Translated that means stocks go down a lot faster than they go up.

What Does This Company Do?

Halliburton Company provides a range of services and products for the exploration, development, and production of oil and natural gas to oil and gas companies worldwide.

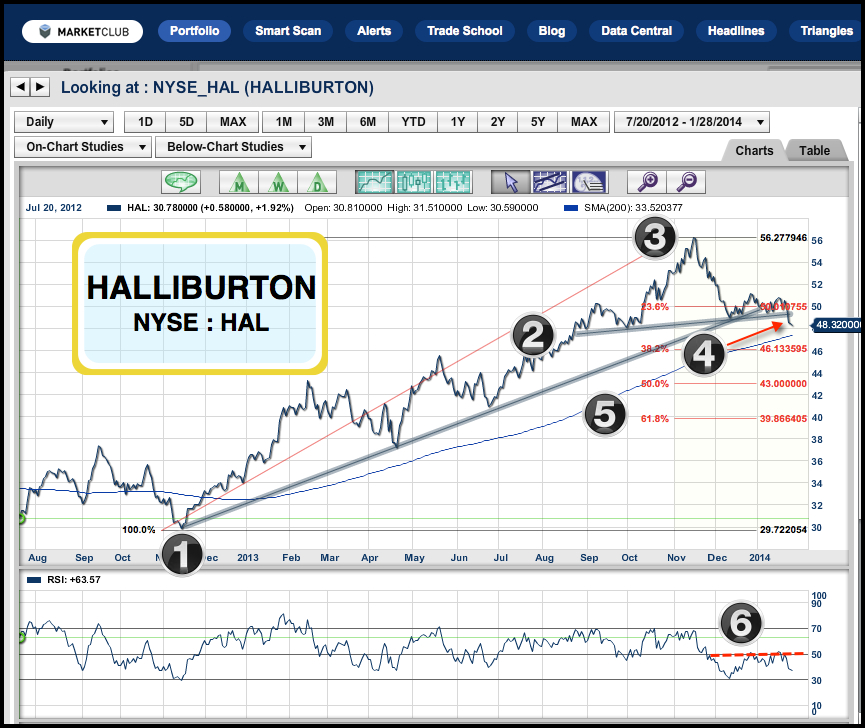
Chart Legend & Technical Picture (Black Numbers)

Continue reading "In-Depth Analysis: Halliburton Company (NYSE:HAL)"

In-Depth Analysis : Texas Instruments Inc. (NASDAQ:TXN)

Today, I'm going to be looking into the stock of Texas Instruments Inc. (NASDAQ:TXN). I found this stock using MarketClub’s Trade Triangles scan, scanning for new weekly Trade Triangles. Since the monthly Trade Triangle was already green, the new green weekly Trade Triangle today is an indication that the intermediate term trend is now in sync with the long term uptrend. It indicates that all systems are go and the upward trend has resumed for Texas Instruments.

This in-depth analysis of Texas Instruments Inc. (NASDAQ:TXN) is for educational purposes only. I am seeing certain technical elements that are falling in place that look extremely promising for this stock.

What Does This Company Do?

Texas Instruments Incorporated engages in the design, manufacture, and sale of semiconductors to electronics designers and manufacturers worldwide. Continue reading "In-Depth Analysis : Texas Instruments Inc. (NASDAQ:TXN)"

Starbucks Corp. (NASDAQ:SBUX) Under The Microscope

Let me start off by saying that I think Starbucks Corp.(NASDAQ:SBUX) makes a great cup of coffee and provides a very good service. Having said that, I don't like the stock of Starbucks right now.

Today a monthly red Trade Triangle triggered, which is the first monthly Trade Triangle we have had in 14 months. This is a significant technical development and it indicates changes in the picture and direction of Starbucks and should not be ignored. Continue reading "Starbucks Corp. (NASDAQ:SBUX) Under The Microscope"

Best Buy (NYSE:BBY) Implodes

Best Buy Co., Inc. (NYSE:BBY) was one of the top performing stocks in 2013. Best Buy (NYSE:BBY) reported on Thursday that total revenue and sales at its established US stores fell in the all-important holiday season due to intense discounting by rivals, supply problems for key products and generally weaker traffic in December. After starting out the trading year of 2013 at $12, this stock performed like the energizer bunny and kept going and going and going for most of the year. It hit a high of $44.60 on November 13th, a month before the all-important holiday season reality set in.

What Does This Company Do?

Best Buy Co., Inc.(NYSE:BBY) operates as an e-commerce and physical retailer of consumer electronics in the United States, Europe, Canada, and China.

Was Best Buy's Implosion Predictable?

No one can predict with 100% certainty what's going to happen in any given market. What technical analysis can do, and does do very well, is put the odds in your favor and give you a high degree of confidence that something is going to happen. It also acts to protect your capital when things go wrong in a market. That is done through the use of money management and discipline, both of which I talk about frequently on this blog. Let me illustrate for you how two simple technical tools would have helped you avoid today's disaster in Best Buy. Continue reading "Best Buy (NYSE:BBY) Implodes"

Dollar Tree, Inc. (NASDAQ:DLTR) Under The Microscope

Today, I'm going to be analyzing Dollar Tree, Inc.(NASDAQ:DLTR). Dollar Tree has had enjoyed a spectacular rise over the last 5 years. After trading below $7 in January of 2008, this stock stayed in a pretty convincing uptrend and made an all-time high of $60.19 on October 21, 2013.

This in-depth analysis of Dollar Tree is not to say the stock can’t go higher, perhaps later in the year, but rather noting certain technical elements that are falling in place that do not look good for this stock. You only have to look back at stocks like Netflix and Apple to see how they can have spectacular falls from all-time highs and still come back.

Not shown on today's chart are 2 negative engulfing lines that occurred in the past 9 weeks on the weekly chart. That is another bad technical sign for this market.

What Does This Company Do?

Continue reading "Dollar Tree, Inc. (NASDAQ:DLTR) Under The Microscope"