Gold And Oil Breakout: We Can Benefit!

Aibek Burabayev - INO.com Contributor - Metals


In my earlier posts I showed you how gold and crude oil broke out of their trends. Gold moved higher amid an oil break down. The simplest trade here is the purchase of gold on the dip and the sale of oil on pullbacks. Today I want to share with you some other options. We can use oil related currencies instead of oil as they tend to lag and overreact to oil moves.

Chart 1. Gold Vs. Russian Ruble Weekly: Say Hi To A New High!

Gold Vs. Russian Ruble Weekly Chart
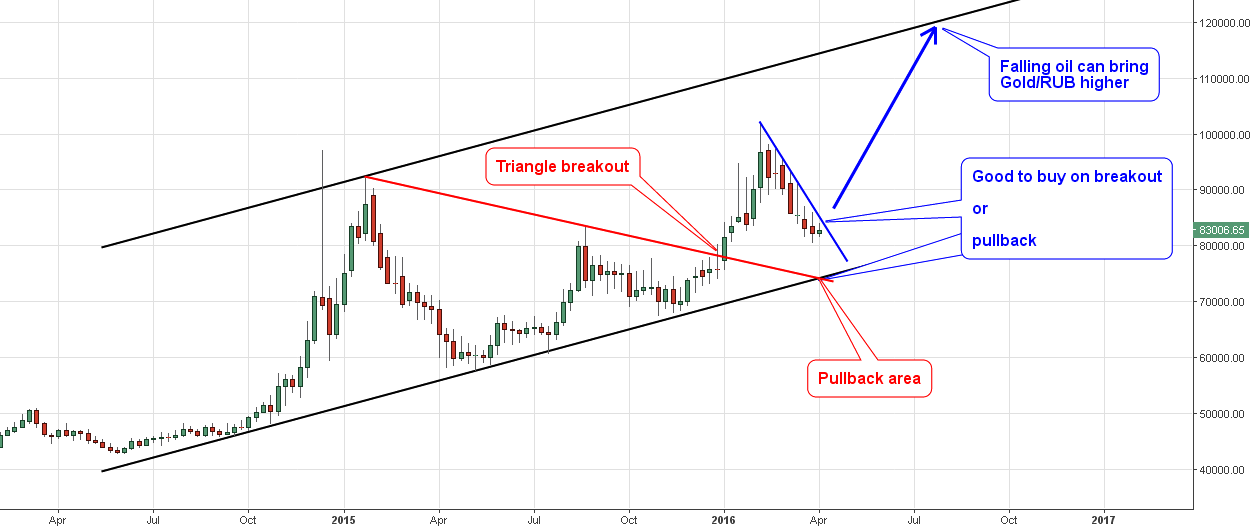
Chart courtesy of tradingview.com

The currency of the world largest country stopped strengthening only last Friday despite that oil reversed much earlier. I call this an overreaction of the currency to the oil move. I guess it’s all about the mechanical reaction of retail USDRUB sellers to the ruble and oil strength which was gone long before they started to act. Usually, non-professional players tend to sell bottoms and buy tops on market panic. Another good thing in this market is that while the ruble was strengthening gold pulled back down, giving potential buyers extra bonuses (falling gold + overreacting ruble).

The Gold/RUB pair has been in an uptrend for 2 years. At the start of 2016 the market it broke out of the triangle above the RUB 78K level and then rapidly moved higher. It topped beyond 2015 high at RUB 101,858 level in February. Continue reading "Gold And Oil Breakout: We Can Benefit!"

Strategy Trading Using Next Day Predictive Highs and Lows

We get a lot of questions here at INO.com about how to use highs and lows to predict market movement. As a treat to our blog readers we have asked Darell Jobman, a leading expert in technical analysis to share some his techniques. In this video workshop you'll discover how to putting indicator clues together to identify setups for a new trend.

Watch Now: Spotting Breakouts That Lead To Trend Reversals

Best,
The INO.com Team

Anatomy Of The Gold Market

Well it was quite a weekend here on the East Coast with a record-breaking blizzard that closed down Washington DC today and made digging out from the 30-some inches of snow quite an interesting challenge. For those of you who live on the East Coast like us, we hope that you and your loved ones were all safe over this dangerous storm.

Now let's take a look at the gold market. This market has been in a bear market for the last four years, almost the exact opposite of the equity markets that have been going up for the last six years. It appears technically that gold is once again coming into style as more investors are becoming leery of the equity markets and the value of their holdings and money in general.

A great deal of this uncertainty has been created by the Federal Reserve Board and the European Central Bank which seemed to have run out of ideas and tools. It appears to this observer that in the last few years these two central banks have literally been winging it on a hope and a prayer. I hope I am wrong on the one as it will make 2008 look like a walk in the park.

8 year daily chart of gold

CHART 1

Looking at the long-term chart of gold, you see a MAJOR LONG-TERM SUPPORT TREND LINE that supported gold for several years before it was broken (see figure 1 on the chart). After breaking below the support line, the gold market again tried to rally, but failed (you can see this in figure 2), which created a TWIN MOUNTAIN TOP. Once through (figure 3) the PIVOT POINT, it was all over for gold as it moved into a major bear market that has now lasted just over four years.

The big question is … has the bear market in gold come to an end? Continue reading "Anatomy Of The Gold Market"

Traders and Trendlines: A Match Made In Opportunity Heaven

By Elliott Wave International
It's the start of the winter holidays -- which, if your family is anything like mine, is also the beginning of a long tradition of deeply regrettable line-crossing, i.e.:

  • Crossing that line into interrogating "new" dinner guests as to why they are still single
  • Crossing that line into inviting your recently divorced sister-in-law to "stay as long as" she needs
  • Crossing that line into a third (no, let's be honest) fourth helping of pecan pie

In these cases, crossing "the line" is the first step down a proverbial mine field of emotional and physical discomfort. And there's no going back!

But in the world of technical analysis of financial markets, crossing one kind of line is often the first step to identifying a high-confidence trade set-up. The line I'm talking about is the trendline. Continue reading "Traders and Trendlines: A Match Made In Opportunity Heaven"

Strategy Trading Using Next Day Predictive Highs and Lows

INOTVWe get a lot of questions here at INO.com about how to use highs and lows to predict market movement. As a treat to our Trader's Blog readers we have asked Darell Jobman, a leading expert in technical analysis to share some his techniques. 

In this video workshop you'll discover how to putting indicator clues together to identify setups for a new trend. Darrell has been writing about financial markets for more than 35 years and has become an acknowledged authority on derivative markets, technical analysis and various trading techniques.

Watch Now: Strategy Trading Using Next Day Predictive Highs and Lows

Best,
The INO Team