The MarketClub Minute - Lesson 1

Our passion at MarketClub is to educate traders and in this spirit, Adam invites you to take just one minute out of your day for the first of his 8 part MarketClub Minute series. These 8 tips that have made him a better trader and can only help improve your trading as well.

Loading the player...

Every Success,
Adam and The MarketClub Team

Traders Toolbox: Williams %R Revisited...

Trader's Toolbox

At MarketClub our mission is to help you become a better trader. Our passion is creating superior trading tools to help you achieve your goals -- no matter which way the markets move -- with objective and unbiased recommendations not available from brokers.

The Trader's Toolbox posts are just another free resource from MarketClub.

---

Stochastics with MarketClub

"MarketClub is known for our “Trade Triangle” technology. However, if you have used other technical analysis indicators previously, you can use a combination of the studies and other techniques in conjunction with the “Trade Triangles” to further confirm trends.

Williams’ %R oscillator, attributed to Larry Williams, is a variation of the stochastics indicator previously discussed. Because the two oscillators are essentially the same, only minor modifications to the formula are required. The formula for calculating %R is: %R = Hn – C / Hn – Ln where Hn = highest high of the period, C = Close of the current period and Ln = lowest low of the period..."

Revisit the Trader's Toolbox Post: "William's %R" here.

Traders Toolbox: Stochastics (K%D) Revisited...

Trader's Toolbox

At MarketClub our mission is to help you become a better trader. Our passion is creating superior trading tools to help you achieve your goals -- no matter which way the markets move -- with objective and unbiased recommendations not available from brokers.

The Trader's Toolbox posts are just another free resource from MarketClub.

---

"MarketClub is known for our “Trade Triangle” technology. However, if you have used other technical analysis indicators previously, you can use a combination of the studies and other techniques in conjunction with the “Trade Triangles” to further confirm trends.

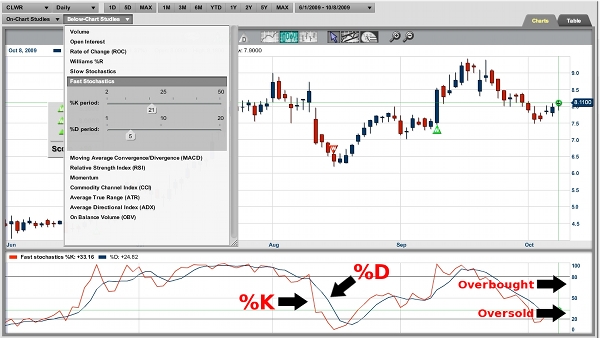
The stochastics indicator created by George Lane measures the relative position of the closing price within a given time interval. This indicator is based upon the premise that prices tend to close near the upper portion of a trading range during uptrends and near the lower portion of a trading range during downtrends. When prices close in the middle of a range, this suggests a sideways market. There are two components to this calculation, the %K value and the %D value. The %K is calculated as follows: %K= (C-Ln / Hn – Ln) x 100 where C = closing price of current period, Ln = lowest low during n time periods. Hn = highest high during n time periods and n = number of periods.

The %D value is the moving average of the %K value. The simple moving average calculation is: %D = 100 (Hn / Ln) also in the %K formula..."

Revisit the Trader's Toolbox Post: "Stochastics" here.

Traders Toolbox: Relative Strength Index Revisited...

Trader's Toolbox

At MarketClub our mission is to help you become a better trader. Our passion is creating superior trading tools to help you achieve your goals -- no matter which way the markets move -- with objective and unbiased recommendations not available from brokers.

The Trader's Toolbox posts are just another free resource from MarketClub.

---

"MarketClub is known for our “Trade Triangle” technology. However, if you have used other technical analysis indicators previously, you can use a combination of the studies and other techniques in conjunction with the “Trade Triangles” to further confirm trends.Developed by Welles Wilder, the Relative Strength Index (RSI) addresses the two major flaws of momentum – the need to have a constant band against which to compare price movement and the ability to smooth the ebb and flow of price movement.

Sharp up or down movement 10 days ago (in the case of a 10-day momentum line) can cause pronounced shifts in the momentum line even if the current prices are relatively stable, giving false signals. Also, different commodities may have different “overbought” and “oversold” levels. RSI corrects these concerns by smoothing the movement and by creating a constant range from 0 to 100...."

Revisit the Trader's Toolbox Post: "Relative Strength Index" here.

Walk the walk, trade the trade, and talk the lingo

As a way of showing our thanks for your support in 2010, we are making available to you a compendium of trading terms that you will find useful in the New Year.

The download is a PDF document that you can view onscreen or print out and have a permanent copy next to you.

We hope that the coming year is even better for you than 2009 and that we can continue to be your website of choice.

From all of us here at INO.com and MarketClub.com, we wish you and yours a safe and Happy Holiday season and a most prosperous New Year!