
MarketClub is known for our "Trade Triangle" technology. However, if you have used other technical analysis indicators previously, you can use a combination of the studies and other techniques in conjunction with the "Trade Triangles" to further confirm trends.
Developed by Welles Wilder, the Relative Strength Index (RSI) addresses the two major flaws of momentum – the need to have a constant band against which to compare price movement and the ability to smooth the ebb and flow of price movement.
Sharp up or down movement 10 days ago (in the case of a 10-day momentum line) can cause pronounced shifts in the momentum line even if the current prices are relatively stable, giving false signals. Also, different commodities may have different “overbought” and “oversold” levels. RSI corrects these concerns by smoothing the movement and by creating a constant range from 0 to 100.
The formula for calculating RSI is as follows: RSI= 100-[100/(1+RS)] where RS= average of the days closing higher during the interval divided by the average of the days closing lower during the interval.
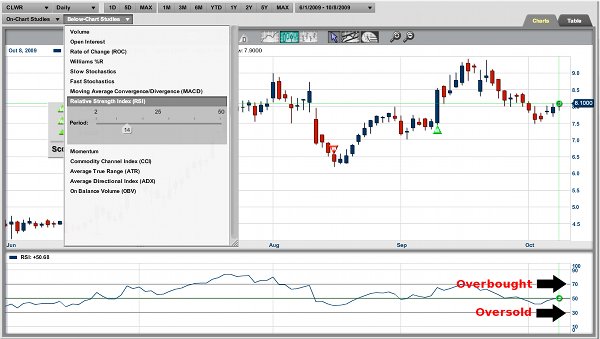
The RSI indicator is plotted on a vertical scale of 0 to 100. The general rule of thumb is overbought levels are at 70% and oversold levels are at 30%. When the reading of the indicator surpasses 70, an overbought conditions exists. An oversold condition exists with readings below 30.
Similar to momentum, a trader should look for bullish and bearish divergences to occur when trading with RSI. A 14-day interval is commonly used, but personal fine-tuning and experimentation always is needed.
---
 You can learn more about the Relative Strength Index by visiting INO TV.


 Stan Ehrlich graduated from Southern Illinois University in 1971 and joined Conti Commodities Services in the fall of that year. After trading for a few years, Stan invented the Ehrlich Cycle Finder, a physical, accordion-like device used to find cycle activity in any chart. The oldest mechanical technical analysis tool in the futures industry, the Ehrlich Cycle Finder can be used on all kinds of markets worldwide. Often quoted in publications such as Bond Week, Successful Farming Magazine, Crane Chicago Business Weekly, Futures magazine, and Stocks and Commodities magazine, Stan has also made numerous appearances on television and radio. Several technical analysis texts mention or detail the Ehrlich Cycle Finder. Stan has taught at dozens of investment seminars around the world, including several real-time trading seminars. In the past, Stan has worked with such well-known investment personalities as Jake Bernstein, Robert Prechter, and Robert Saperstein. Stan currently faxes a timely technical analysis market letter to his clients every few days.