Traders Toolbox: Gann Theory

MarketClub is known for our "Trade Triangle" technology. However, if you have used other technical analysis indicators previously, you can use a combination of the studies and other techniques in conjunction with the "Trade Triangles" to further confirm trends.

W.D. Gann was a trader in the early 1900s who devised a unique and complex trading method that parallels some of these other theories. His technique is sometimes referred to as geometric because of his use of the mathematical properties of certain geometric figures and angles to predict price behavior. Gann had a cyclic view of market behavior and placed enormous emphasis on proportional relationships between price and time. He believed market events occurred at intervals that could be determined mathematically. And like Elliott, he believed the relationships he “discovered” reflected the natural law of the universe.

Gann calculated price retracements on percentages derived from dividing price action into eights, i.e. 2/8 = 25%, 4/8 – 50%, etc. He also included the Dow and Fibonacci retracements of 1/3 (33%) and 2/3 (67%) in his list of key percentages. He constructed support and resistance lines (Gann lines) based on varying ratios of time units to price units. His most important trend line, plotted at 45 degrees (up from a market bottom or down from a market top) represents one unit of time movement per one unit of price movement.

He also placed lines with other time/price ratios, like 1:2, 2:1, 1:3. 3:1, etc. The angle of these lines corresponds to the strength and speed of a trend. As long as pries stay above (or below, depending on the direction of the trend) the 45-degree line, the trend will continue. Once prices break that line, they will theoretically proceed to the next line of resistance, 1:2 or 1:3, for example, as the trend is played out.

Gann determined “anniversary dates” for timing market events based on the degrees of a circle (30, 60, 90, 180, 360 days) as well as periods of 12 months and 144 days (144 is the only square Fibonacci number). For example, when a market made a high or low, Gann looked for another significant price milestone 144 days or a year in the future.

He also predicted future support and resistance points using “cardinal squares.” Starting with a low price for a contract, he spiraled prices clockwise around it on a grid until the prices reached the current trading range. Prices that fell on the “cardinal cross,” the perpendicular lines equivalent to the X and Y axes of a graph, represented probable levels of future support and resistance.

Gann techniques are most effective when used together. Instances in which a trend reversal corresponds to a previously calculated retracement ratio, a cardinal square price, an anniversary date and the breaking of a trend line would represent important market cycles.

---

You can learn more about the Gann Theory by visiting INO TV.

"Saturday Seminars" - Does A "Holy Grail" Really Exist ... And Should You Look For It?

In this workshop, John Hayden will examine if there were a "Holy Grail", what would be its characteristics and how would we know it was the "Holy Grail" if we did discover it? Before computers, men became great traders by studying human nature, history and acquiring all the relevant facts about a particular industry. The traders that read the "tape" were very aware of the psychology of other traders and the market.

Today we use the biographies and autobiographies of previous traders in conjunction with the study of what propels an individual to the top of his chosen profession. It is a fascinating study, one that strips away at many of the myths concerning what it really takes to become "one of the best."
The outcome of this talk is to empower everyone present so that they may take some of this new knowledge and immediately use it to increase their profitability. Every trader needs a way to perceive the marketplace; this "way" may be through technical analysis, fundamental analysis, or by trading in the "moment". However, before these techniques can be used the trader must master his own beliefs and thoughts. All traders look for certainty and desire courage and confidence. This is only possible by mastering one's beliefs, increasing ones virtues and decreasing ones vices.

Just a few of the topics that John will cover are:

-Confidence is required for success.

-Disciplined traders are consistently profitable.

-Doubt, hesitancy and indecision - a sure fire way to ruin.

-Developing a written strategy for trading your methodology.

John HaydenJohn Hayden is the Director of Risk Management for Directional Research & Trading Ltd. From 1998 to 1999, John worked for Lind-Waldock as a Managed Account Representative where he advised clients on Asset Allocation and Risk Control. Prior to that John Hayden was CEO of PGM Refining Ltd., a Colorado firm that specialized in the processing and refining of gold and platinum group metals where he hedged and traded inventories in the futures and cash markets. John was the founder and CEO of Continental Security Products Inc., a Colorado firm that imported high security equipment from England and other international sources. His clients included Fortune 500 companies, as well as many of the large jewelers in the United States.

In the spring of 1999, John Hayden wrote "The 21 Irrefutable Truths of Trading" which McGraw-Hill is publishing in May 2000. John started day trading stocks while in college in 1975, shifting his focus to commodities in 1992. He earned an A.A.S. degree in Business Administration from Dutchess College and studied Geo-politics at the University of Plano.

---

Saturday Seminars are just a taste of the power of INO TV. The web's only online video and audio library for trading education. So watch four videos in our free version of INO TV click here.

INO TV

A Word of Encouragement for the 'Average Trader'

I'm going to cut right to the chase...READ THIS!! Our good friend Norman Hallett from DirectYourMind.com has been an expert in the psychology of trading for years! He's helped, and helping, thousands of traders a day to get their minds right. So read this article and check out Normans site.

=================================================================

"Deep recession!"

"Depression!"

"End of the world as we know it!"

Anyone who's tuned into CNBC or CNN has heard these statements of doom and gloom.

They may or may not be true.

We are not in control of what happens to the economies of the world.

We ARE in control of how we handle our personal finances in light of these possibilities and, as traders, how we choose to TAKE ADVANTAGE of all situations... including this one.  No, ESPECIALLY this one.

We know that price action is a reflection of what is perceived "to be", not what is.  We know if we take a position and employ money management techniques, then
if we are wrong in our position, we will get pinched and not punched... and we'll re-analyze and go again.

It's the way of the trader.

For the trader, the greater the economic challenge, the greater the opportunity to better ourselves and our family... through our trading.

When most individuals are hiding behind excuses, the trader steps up to the plate.

We are lucky, indeed.

But don't fool yourself. Being a trader, is not easy.

I look at markets in turmoil and I "feel" for the average trader.

The average trader has every good intention, but lacks the two basic elements to consistent trading success...

A formulated trading plan, whose elements are the components of a good trading system or systems, is the first element. And having the mental and emotional discipline to run that plan is the second element.

The GREAT NEWS for the 'average trader' is that it doesn't take years to elevate your level of trading... months, yes, but not years.

The further GREAT NEWS is that we are in historic times.

The opportunities that will unfold over the coming weeks, months and years could result in windfall profits for those traders who choose to master the two elements mentioned above.

Shake-outs like we are experiencing now in the marketplace yield new super-trends that may be followed.. and ridden... by those who are prepared.

So should you "drop back and punt", and stand aside while the market displays its current violent ways?

Only you know the answer to that.

Are your two basic elements solid?

Is your trading plan MEANT to handle extremely high volatility?

For any average trader... these are the type of markets that exploit your weaknesses.

FOR YOU, it's time to re-group and prepare yourself for the opportunities that are about to present themselves as the smoke starts clearing.

Adopt a solid trading plan, based on a solid trading system. AND

Start now to make the development of your trading discipline a PRIORITY.

Without COMMITMENT to these two elements, you will not succeed on a consistent basis and will not be able to take advantage of the opportunities to come.

This is NOT the time for excuses.

It's your time for admission... recognizing that you do, in fact, possess these two elements, or admit that you don't and work NOW on shoring them up.

I've been trading for 25 years I can say with confidence that the opportunities that are about to unfold will be historic.

Fortunes will be made.

The Disciplined Trader with a tested trading plan and possesses solid trading disciplined will gather the money of The Average Trader who continues to downplay both.

It's time to prepare.

Norman Hallett

DirectYourMind.com

Traders Toolbox: Elliott Wave Theory

MarketClub is known for our “Trade Triangle” technology. However, if you have used other technical analysis indicators previously, you can use a combination of the studies and other techniques in conjunction with the “Trade Triangles” to further confirm trends.

Elliott Wave Theory categorizes price movement in terms of predictable waves. Beginning in the late 1920s, R.N. Elliott developed his own concept of price waves and their predictive qualities. In Elliott theory, waves moving with the trend are called impulse waves, while waves moving against it are called corrective waves.

Impulse saves are broken down into five primary price movements, while correction waves are broken down into three. An impulse wave is always followed by a correction wave, so any complete wave cycle will contain eight distinct price movements. Breaking down the primary waves of the impulse/correction wave cycle into subwaves produces a wave count of 34 (21 from the impulse wave plus 13 from teh correction wave), producting more Fibonacci numbers.

Elliott analysis can be applied to time frames as short as 15 minutes or as long as decades, with smaller waves functioning as subwaves of larger waves, which are in turn subwaves of still larger formations. By analyzing price charts and maintaining wave counts, you can determine price objectives and reversal points.

A key element of Elliott analysis is defining the wave context you are in: Are you presently in an impulse 
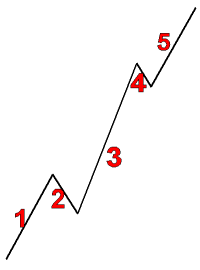
wave uptrend, or is it just eh correction wave of a larger downtrend? The larger the time frame you analyze, the larger the trend or wave you find yourself in. Because waves are almost never straightforward, but are instead composed of numerous subwaves and minor aberrations, clearly defining waves (especially correction waves) is as much an art as any other kind of chart analysis.

Fibonacci ratios play a conspicuous role in establishing price objectives in Elliott theory. In an impulse wave, the three principal waves moving in the direction of a trend are separated by two smaller waves moving against the trend. Elliotticians often forecast the tops or bottoms of the upcoming waves by multiplying previous waves by a Fibonacci ratio. For example, to estimate a price objective for wave III, multiply wave I by the Fibonacci ratio of 1.618 and add it to the bottom of wave II for a price target. Fibonacci numbers are also evident in the time it takes for price patterns to develop and cycles to complete.

Fire your broker and make money!!

Fire your broker and take control of your own money ... and stop listening to Jim Cramer unless you want to lose more money.


We are serious. According to BARRON'S magazine Cramer has been consistent in one thing and that is underperforming the markets. This is the same guy who recommended buying Wachovia and we all know how that turned out!!

Check out this new FOX TV ad. FOX did not pay us a penny to run this YouTube ad on our blog, we just thought that it really said what a lot of us already know. The king (Cramer) has no clothes.

There is a simple antidote to market chaos and bad advice from your broker or Jim Cramer's putrid picks and that is MarketClub.com. Try it out and check out our track record. If a positive road map and positive returns in turbulent times makes sense to you then try out a 30 day risk free trial to MarketClub.

I am betting you will be glad you did.

Adam Hewison
Co-Creator, MarketClub