Priceline: A Rare Contrarian Play Offering Both Value & Growth

WilliamCikos_Contributor_ImageBadge350


We’ve all seen those lousy William Shatner commercials.

Priceline Group Inc. (SPX: PCLN) is an online travel company that offers its customers hotel room reservations at nearly 300,000 hotels worldwide through the Booking.com, priceline.com and Agoda brands. In the United States, the company also offers its customers reservations for car rentals, airline tickets, vacation packages, destination services and cruises through the priceline.com brand. Additionally, it offers car rental reservations worldwide through rentalcars.com.

PCLN Price Action
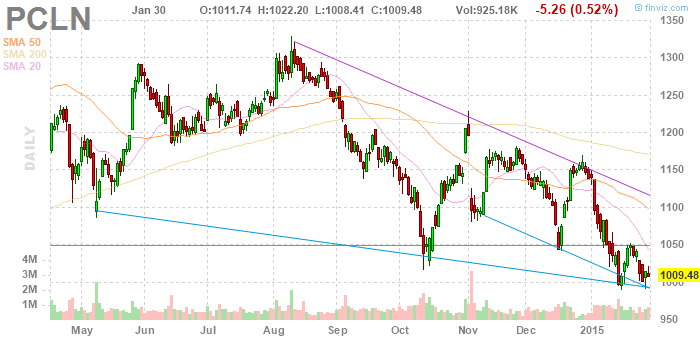
Courtesy of Finviz.com

Priceline’s stock has taken a beating in recent months. After closing at $1,009.48/sh on Friday, shares of PCLN have already dipped by 11.6% in the first month of trading this year. On March 6th, 2014, shares peaked at $1,378.96/sh. Now, less than 11 months later, Priceline’s stock trades 37% below that price. Continue reading "Priceline: A Rare Contrarian Play Offering Both Value & Growth"

The Super Bowl Indicator - Seahawks (Bulls) VS. Patriots (Bears)

Have you ever heard of the Super Bowl Indicator? Who do you want to win? Are you a Bear or a Bull?

How it works

The Super Bowl Indicator rules state that if a team from The National Football Conference (NFC) wins the Super Bowl, a bull market will prevail. If a team from American Football Conference (AFC) wins, a bear market will prevail.

The New England Patriots are from the AFC, and they will represent the bear market in 2015. The Seattle Seahawks are from the NFC, and they represent the bull market. If the Seahawks win the Super Bowl, there is an 80% chance that the markets will rise this year.

I don't know about you, but I want the Seahawks to win again this year.

There are two notable exceptions as of late:

2013 saw the Baltimore Ravens (AFC) win the Super Bowl, and the DOW rose 26.5%. This should have been a bear market.

2008 saw the New York Giants (NFC) win the Super Bowl, and the DOW fell 33%. This should have been a bull market.

Some notable DOW gains from previous years:

1975 saw a gain of 38% when the Pittsburgh Steelers won Super Bowl IX.

1989 saw a gain of 27% when the San Francisco 49ers won Super Bowl XIX.

2003 saw a gain of 25% when the Tampa Bay Buccaneers won Super Bowl XXXVII.

With the big game coming up today, I thought it would be fun to revisit the Super Bowl Indicator and see who you think will win the Super Bowl.

Who do you want to win the Super Bowl?

View Results

Loading ... Loading ...

Have a great time with friends and family watching the big game!

Every success,
Jeremy Lutz
INO.com and MarketClub.com

What are today's top 50 stocks? This free list will share the big market movers on a daily basis to help you find trading opportunities.

View this list for free now.

Precious Metal ETF's Seeing Interesting Action

Matt Thalman - INO.com Contributor - ETFs


Since the start of January the price of Gold and Silver have risen nicely as both metals are seen as a hedge against inflation and purchasing power over time. With continued low interest rates in the U.S., the announcement of QE in the Eurozone, debt issues in Greece, and the Swiss playing games with their own currency, many investors have begun looking for safe havens.

With Gold and Silver being the most trusted safe havens by many, and gold and silver ETF's making it easy for investors to quickly get in and out of owning the metals, we are seeing some interesting actions in two ETF's that actually own bullion itself. The SPDR Gold Shares (GLD) ETF owns actual gold bullion while the iShares Silver Trust (SLV) ETF owns actual silver bullion. The fact that these ETF's own actual bullion is key because their underlying assets are based on the price the metals are trading for at any given time, not futures contracts, miners or any other way to play the metals.

As it would be expected, with what is happening around the world, these ETF's have risen substantially year-to-date; iShares Silver Trust is up 9.83% while SPDR Gold Shares has climbed 8.69%. These move come while the S&P 500 has actually lost 3.1% year-to-date.

But here is what is interesting about these moves; net flows, or the amount of cash moving in or out of these funds are wildly different. iShares Silver Trust ETF has seen $175 million flow out of the fund since January 1 while the SPDR Gold ETF has seen $1.93 billion flow into the fund, according to etf.com data. So why is this happening? Continue reading "Precious Metal ETF's Seeing Interesting Action"

Sterling Momentum Softens

Lior Alkalay - INO.com Contributor - Forex


In our last review on the Pound Sterling, we noted that the currency had been weak amid a soft patch in the UK economy. The pace of GDP Growth was slowing and unemployment was no longer falling, yet the robust retail sales figure had provided a bright spot for Sterling bulls. While growth momentum has continued to slow, it has remained fair, and with massive easing coming from across the Channel, i.e. the ECB’s QE program, Sterling was able to gain ground vs its European peer. Yet, with the BoE meeting looming next week, and the release of the February inflation report and Mark Carney’s follow speech, there is growing speculation that the BoE may open the door for a possible retreat, or perhaps even a U-Turn, in its plans for rate hikes. What is that speculation based on and how could it impact the Pound Sterling? Continue reading "Sterling Momentum Softens"

The History & Likelihood Of V-shaped Oil Recoveries

Adam Feik - INO.com Contributor - Energies


In recent days, crude oil and natural gas prices have continued to undulate within a range near their lows. What’s next for the commodities, and for the energy companies whose fortunes are joined at the hip of oil and gas?

With producers like Shell, Occidental Petroleum, BP, and ConocoPhillips announcing big-dollar capital spending cuts, will oil’s chart soon be tracing a V-shape?

Will history rhyme?

Phil Flynn presented the following analysis in his article for Futures Magazine yesterday:

“In 12 data points when oil had a break of 40% or more within a year the market rallied back 52.8% within 12 months. Even when the break was only 30% with 20 times the rebound was still a very impressive 45.5% within 12 months. This snap back comes usually as the market realizes that a period of low prices will stimulate demand and cut backs in production will take their toll.”

Richard Hirayama, portfolio manager for WHV Investments, provided a similar perspective – based on calendar years – in his portfolio manager letter this month. Hirayama furnished this nugget: Continue reading "The History & Likelihood Of V-shaped Oil Recoveries"