
If you follow our blog, then you are definitely familiar with trader Larry Levin, President of Trading Advantage LLC. We have gotten such a great response from some of his past posts that he has agreed to share one more of his favorite trading tips as a special treat to our viewers. Determining the direction of the market can be tricky and just plain confusing at times, but Larry’s expert opinion keeps it simple and straight-to-the-point.
If you like this article, Larry’s also agreed to give you free access to his award winning book.
Today he’s going to talk about knowing your way around a chart.
For most traders, charts are like their road maps to potential trades. Technicians see potential patterns, key clues that they interpret for trading opportunities. Fundamentalists see confirmation of news stories or supply and demand dynamics playing out in the price fluctuations. Charts are indispensable to traders
Understanding what a chart is telling you is paramount for traders
We are going to look at the two most common chart types, and the basics of their construction. The main thing to understand when you are looking at any given chart is that there is key info that shouldn't change. Each chart will be showing you prices on one axis and time periods on another. Most charts will show the prices on the vertical axis and time periods (e.g. daily, hourly, five minute) on the horizontal one, like this: Continue reading "Knowing Your Way Around A Chart"
 Trader Larry Levin, President of Trading Advantage LLC, has agreed to share one of his favorite trading secrets as a special treat to our viewers. Determining a trend can often be tricky. Get Larry’s expert opinion on how to keep it simple. If you like this article, you won’t want to miss his
 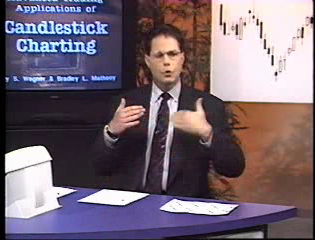 Brad Matheny and Gary Wagner, founders of International Pacific Trading Co., are giving you a free video workshop just for following our Trader’s Blog! In this video, you'll discover the crucial chart patterns that candlesticks reveal - how to interpret them and how to use them to pinpoint market turns. You'll also learn how to use candlesticks in combination with familiar technical indicators like Stochastics, %R, Relative Strength Index and Moving Averages to create a dynamic, synergistic and extremely successful trading system.