Crude Oil Crashes Through $30 And The Market Follows

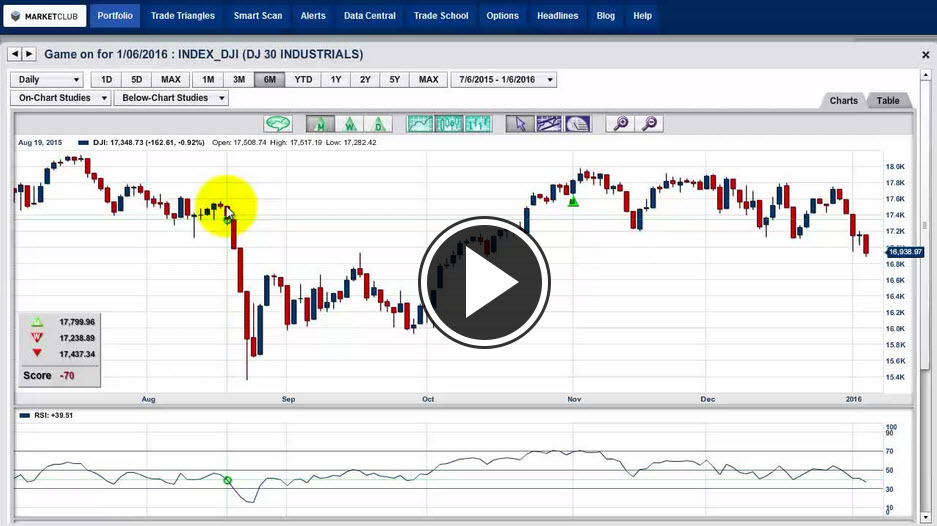
This is turning out to be a very expensive week for investors who are still holding long positions in this market. As I warned late last year and all this year, I felt the market was and is going to be volatile and more than likely going lower.

Let's go back several years to the first quarter of 2009 when the equity markets bottomed out and began their six-year climb to the stars.

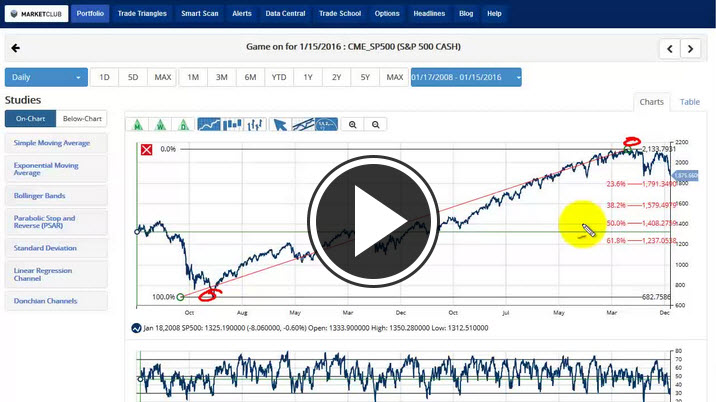
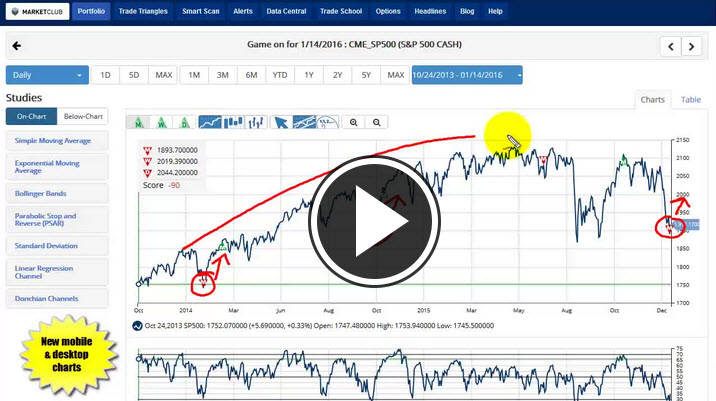
If you look at the S&P 500, you can see that it made a low on the week of March 2, 2009 at 683.38. Six years later on the week of July 13th it closed at a high of 2126.64. I want to look at the market using the Fibonacci tool and see potentially where this index might be headed on the downside. A classic 38.2% Fibonacci retracement takes this index back to 1,574, (it closed at 1,921.84 yesterday). A 50% retracement would bring the S&P 500 back down to 1405.51 and a 62% retracement would take it all the way back down to 1236.24.

The S&P 500 closed last Friday at 1922.03 Continue reading "Crude Oil Crashes Through $30 And The Market Follows"

Exactly 1 Year Ago Today, GoPro Gave A Sell Signal At $46.50

Hello everyone! GoPro, Inc. (NASDAQ:GPRO) had a sell signal exactly a year ago today indicating that this stock was in trouble and headed lower. That signal came in at $46.50 on a monthly Trade Triangle. GoPro is currently trading below $12 a share.

Two of the major indices are now officially in bear markets based on the Trade Triangle technology. I have talked about the power of the Trade Triangles and how they can give off early warning signals of impending changes in the market. For example, if you look back last December, members received an early warning signal that all was not well in the S&P 500. That signal came in the form of a weekly Trade Triangle on December 11th at 2,019.39. As I write this commentary, the S&P 500 is currently trading at 1,880! The same warning signals occurred in both the Dow and the NASDAQ. These warning signals occur in stocks as well, take a look at Apple Inc. (NASDAQ:AAPL), Best Buy Co. Inc (NYSE:BBY), Under Armour Inc. (NYSE:UA) and a host of other stocks that were once thought to be invincible.

If you have been reading this blog for any length of time you've heard me make the statement, "they slide faster than they glide". That means that markets tend to go down much faster than they go up. Some market pundits blame it on gravity, I just say that perception may be the real culprit here. Right now confidence in the market is low and perception is high that there is more trouble ahead. Continue reading "Exactly 1 Year Ago Today, GoPro Gave A Sell Signal At $46.50"

Is Apple About To Break $100?

Hello MarketClub members everywhere! I've just returned from a short mini break over Christmas and New Year's to see the market crashing down this morning. This should come as no surprise to anyone as I have been talking about the negative chart implications that we were seeing in the major indices last year.

Indices

As far back as November 16th I warned that a weekly Trade Triangle had given a signal to move to the sidelines in the DOW index. That same Trade Triangle signal was followed a short while later in both the S&P 500 and the NASDAQ. The rocky start to the New Year should have come as no surprise to MarketClub members.

Gold

Concern over China along with a weak equity market here in the US was enough to push Gold (FOREX:XAUUSDO) to its best levels in some time and in doing so gave an important Trade Triangle buy signal. The Trade Triangle buy signal occurred on Tuesday, January 5th at $1,081.55. This is the first buy signal in gold in approximately three months and I believe it is one you should pay close attention to. My upside target for gold is the $1,130 to $1,140 area. Continue reading "Is Apple About To Break $100?"