Crude Oil Crashes Through $30 And The Market Follows

This is turning out to be a very expensive week for investors who are still holding long positions in this market. As I warned late last year and all this year, I felt the market was and is going to be volatile and more than likely going lower.

Let's go back several years to the first quarter of 2009 when the equity markets bottomed out and began their six-year climb to the stars.

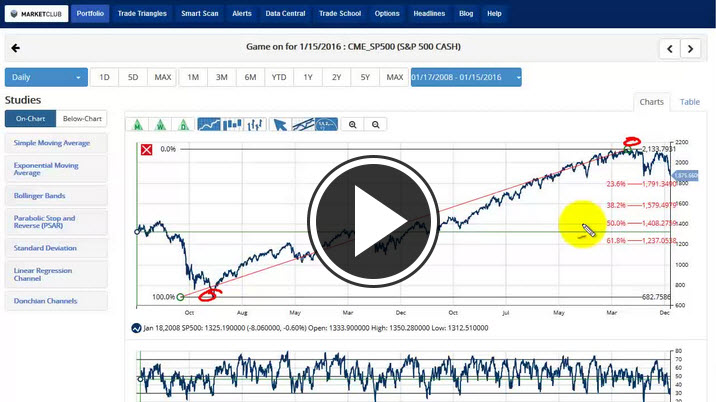
If you look at the S&P 500, you can see that it made a low on the week of March 2, 2009 at 683.38. Six years later on the week of July 13th it closed at a high of 2126.64. I want to look at the market using the Fibonacci tool and see potentially where this index might be headed on the downside. A classic 38.2% Fibonacci retracement takes this index back to 1,574, (it closed at 1,921.84 yesterday). A 50% retracement would bring the S&P 500 back down to 1405.51 and a 62% retracement would take it all the way back down to 1236.24.

The S&P 500 closed last Friday at 1922.03 Continue reading "Crude Oil Crashes Through $30 And The Market Follows"

POLL: Job Report

If you follow headline news, then we don’t have to tell you about the kind of hit that the recent job report had on the major markets this week. OUCH. Just today the DJI fell 105 points, the S&P 500 lost 10 points, and the Nasdaq fell 21 points. The DOW alone shed over 400 points since Wednesday!

The increase in unemployment has caused major concern for experts, as well as all of us regular ol’ citizens of the USA. The recent job report was a definite letdown, especially for economists who were predicting a rate of improvement from 9% to 8.9%. Yet here we are with an unemployment rate of 9.1%.

Where do you think the US unemployment rate will be at the end of 2011?

View Results

Loading ... Loading ...

Be sure to Joins Susan, live at 1PM (ET) for your live update on the markets!

1PM Update (5/23/11)

Hello, Adam Hewison here for MarketClub. I hope you were able to join me for today's market update. If not, all is not lost. Watch the video below to get caught up!

Here's what we covered in the major markets ...

S&P 500: -70. Only the longer-term monthly Trade Triangle remains intact at this time. Short-term market trend is down. Market at the lower end of the Donchian Channel. Neutral - Major Support at 1,295-1,300.

Silver: Score -55. Stuck at -55 as it continues to move sideways. Spot market needs to move over 36.00 to give this market upward momentum.Bullish divergence on the Williams %R indicator. Near term support at 34.25.Major Support at $32.00. Major resistance at $39.50.

Gold: Score +70. Longer term trend remains positive. All eyes are on $1,520 0n the upside. A close over this level propels market higher. Support at $1,490, $1,475 and $1,462.50. Resistance at $1,526. Market Trending higher.

Crude Oil: +70 Trading range. Long term indicator remains positive. Resistance at 100.80 basis July. Choppy market. Possible bullish divergence on the Williams %R indicator.SUPPORT AT $96.00 for the July contract.

The Dollar Index: Score +70. In a very broad trading range with the longer term Trade Triangle remaining in a negative position. Minor resistance at 76.50 and major resistance remains at 77.50. Minor support at 75.00

The Thomson Reuters/Jefferies CRB Commodity Index: Score +55. Near-term resistance at 344.00. Support at 327.50. Market oversold. Bullish divergence building on the Williams %R indicator. Trade Triangles are negative on this market.

Join me again tomorrow at 1:00p.m. ET for your LIVE and actionable update!

All the best,

Adam Hewison
President of INO.com
Co-founder of MarketClub

It's Thursday!

As usual, we have a busy Thursday planned! Not only did you have a LIVE 1PM ET market update,  but Adam and Susan will be coming to you LIVE at 7PM  ET from the studios of MarketClub. This is the first episode of Marketclub TV since Adam's return, so you don't want to miss it!

Watch what you missed from the 1PM ET Update for 5/19/11:

S&P500: -55. As we mention on Monday and Tuesday the Market is very oversold. Long term uptrend remains intact. Market at the lower end of the Donchian Channel. Neutral - Resistance at 1370

Silver: Score -55. possible bullish divergence on the Williams %R indicator.Major resistance at $39.50.Support at $32.00.

Gold: Score +65. Longer term trend remains positive. Support at $1.475 and$1,462.50. Resistance at $1,526.Trading Range

Crude Oil: +70 Trading range. Long term indicator remains positive. Resistance at 100.80 basis June.Choppy market. Possible bullish divergence on the Williams %R indicator.

The Dollar Index: Score +55. In a trading range with the longer term outlook remaining negative.Possible negative divergence. Look for a pullback?? Minor resistance at 76.00 and major resistance remains at 77.50. Minor support at 74.00

The Thomson Reuters/Jefferies CRB Commodity Index: Score -55. Near-term resistance at 348.50. Support at 333.50.Market very oversold on hedge fund liquidation.Bullish divergence on the Williams %R indicator.

Watch tonight's LIVE episode of MarketClub TV at 7PM ET tonight to see how you can win a FREE one year membership to MarketClub!

See you there,
The MarketClub Team