Chart of The Week - Live Cattle

Each Week Longleaftrading.com will be providing us a chart of the week as analyzed by a member of their team. We hope that you enjoy and learn from this new feature.

Live Cattle Futures Will Continue to Rise Throughout the Summer.

This week's focus turns to August Live Cattle Futures. I am sure many readers have seen the price of beef steadily increasing, especially as of late. In recent years, the state of Texas has been experiencing severe drought conditions which have significantly depleted the state's water source and has limited the amount of cattle that it produces. These conditions have caused ranchers to limit the amount of cattle output, or in some cases close up shop completely. We've had less and less supply to consume which has caused Live Cattle prices to steadily rise.

Over the coming summer months, I expect this trend to continue. US cattle herds are currently at a 54 year low. Along with already tight supply fundamentals, there have been almanac predictions for exceptionally hot conditions across much of the country, Texas included, in late June and through the month of July. The extreme seasonal weather that much of the country saw this past winter is expected to continue throughout the summer. I think that the conditions in Texas will continue to keep supply tight and increase the price of Live Cattle into the month of August.

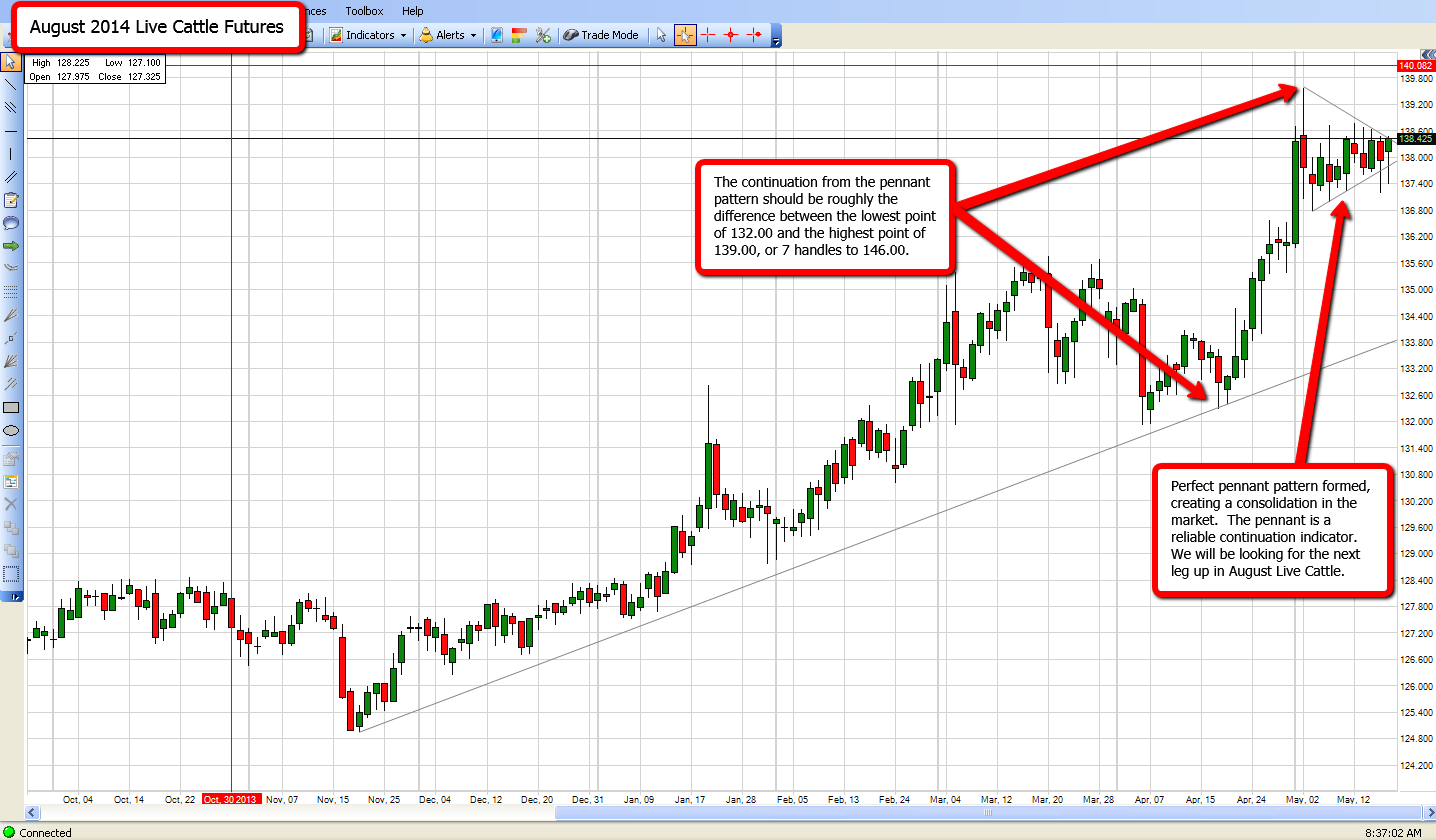
The case for a bullish Live Cattle market is also strong on the technical side. We have seen a steep uptrend in Live Cattle futures since late last year. In the past 2 weeks, the market has consolidated its bullish move to form a perfect pennant pattern which is a continuation signal. If the market breaks this pennant formation strongly to the upside, the next near-term target would be 146.00. Continue reading "Chart of The Week - Live Cattle"

Chart of The Week - Natural Gas

Each Week Longleaftrading.com will be providing us a chart of the week as analyzed by a member of their team. We hope that you enjoy and learn from this new feature.

June Natural Gas (NYMEX:NG.M14.E) opened sharply higher in Sunday evenings session, but since the open prices plummeted to a 5 day low. The sell off confirmed a bearish outside reversal ahead of today's US session. June Natural Gas futures remain under pressure from last week's EIA storage report that showed a larger than expected supply build of 82 bcf. Recent weather forecasts have been calling for warmer temperatures across the country which could limit the size of upcoming supply injections.

In recent weeks, we have been in a sideways trend in the June Natural Gas Market as the market decides on which direction it is headed next. The technical analysis in Natural Gas points to bearish in the near-term, making way for a potential swing trading opportunity.

In today's trading session, I will be looking to sell June Natural Gas futures at 4.660, or a breach of the 20 Day Moving Average. This breach would confirm the outside reversal in today’s trading session. Continue reading "Chart of The Week - Natural Gas"

Chart of The Week - Corn

Each Week Longleaftrading.com will be providing us a chart of the week as analyzed by a member of their team. We hope that you enjoy and learn from this new feature.

As we begin the 2014 planting season, our attention turns to the September 2014 Corn Options. September Corn futures (CBOT:ZC.U14.E) have started out well, supported by a report last week that the crop is already slightly behind in planted acreage (6% vs. 9% estimated). Opening the new week, we see a cool and rainy forecast across the Midwest along with severe weather. We are currently seeing up to 5 inches of rainfall expected over half of the Midwest.

Due to the weather forecast, the planting pace is likely to slow down dramatically this weekend and next week. The 10-year average plating pace for Illinois by April 28th is a little under 40%, while Indiana and Iowa are both about 30%. Historically speaking, we are well behind as plantings could reach near 20% for Monday's update but stall at this figure for the week due to weather delays. The recent weather has added support to the Corn futures, and any further delays should make the price rally considerably.

Since the start of the new year we have been in a strong up-trend in the Corn market. Continue reading "Chart of The Week - Corn"

Chart of The Week - Crude Oil

Each Week Longleaftrading.com will be providing us a chart of the week as analyzed by a member of their team. We hope that you enjoy and learn from this new feature.

As the week starts, our attention turns to the June Crude Oil futures (NYMEX:CL.M14.E). After gaining nearly $7/barrel in less than a month, the market has recently consolidated around $103.50/barrel as it begins to decide which direction it will take. It appears that some of the recent slowing of the market is due to profit-taking, as the recent sharp up-trend may have gained too much too soon. There are a number of fundamental factors at play in the market, many of which seem to work in contrast with each other: support from Russia-Ukraine uncertainty, resistance from ample supply concerns, and improved demand prospects following solid US Economic data last week. With a number of different fundamental factors in play – and uncertainty over which fundamental factor the market will focus on moving forward – I will focus on the technical aspects of the market for a potential trading opportunity.

Thursday’s range last week was consolidated within the previous day’s range and a move above or below that range should give us good direction to go off of. Continue reading "Chart of The Week - Crude Oil"

Chart of The Week - Gold

Each Week Longleaftrading.com will be providing us a chart of the week as analyzed by a member of their team. We hope that you enjoy and learn from this new feature.

After a week where we saw a correction in stock index futures, we will be looking at June Gold Futures (NYMEX:GC.M14.E) to receive a possible flight-to-safety bid. The focus remains on the Russia-Ukraine conflict, where the prospect for violence is extremely high. This shifts the gold market’s focus from physical commodity fundamentals to safe haven issues. Further Russia-Ukraine tensions or continued pressure on stock index futures can provide an influx of buyers in the gold market.

On the technical side, gold has shown a lot of strength after rebounding from its April 1, 2014 low of 1278.3. Last Friday’s session was relatively quiet, consolidating and trading within the previous day’s range between 1324 and 1310.8. For this reason, along with multiple fundamental catalysts, I would be a buyer in June Gold futures and look for it to reach $1350.00 in the near future. Continue reading "Chart of The Week - Gold"