Today I'd like to welcome back Gary from Biiwii.com. I've asked Gary to teach us a bit on divergence.
=============================================================
I want to have a look at divergence by the lower panel indicators and the valuable clues they can provide when used in conjunction with price activity, support/resistance levels and of course fundamentals of a given stock, commodity or other asset.
Divergence can be used to help define bullish or bearish setups. With my M.O. as a 'bottom feeder', today I will focus on a chart that sports most of the components I like to see when setting up for a swing trade; it is the etf UNG (the United States Natural Gas Fund) which has been declining relentlessly from a manic high in June and mercilessly punishing anyone innocent enough to buy into this mini-bubble under the incorrect assumption that it was 'commodities to da moon'. But as "what goes up comes down" so too does the reverse eventually assert itself.
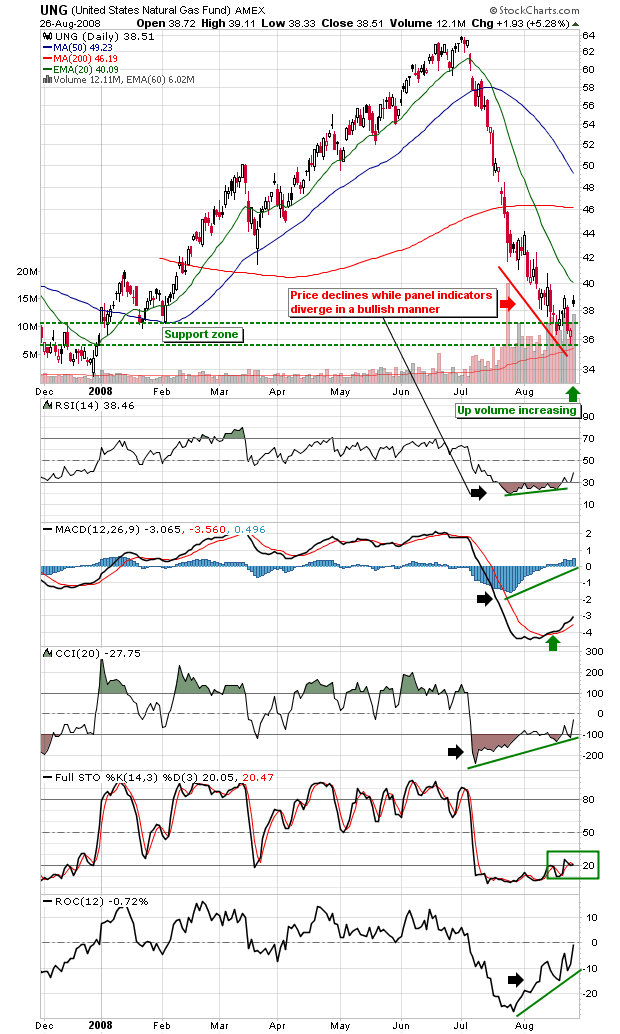
In looking at NatGas, I like the fundamentals much better from a seasonality and value perspective (thanks to a 40% decline) if only for a swing trade into the fall or winter. Fundamentals are the first priority. Check. Next, the decline has brought the price down to a notable area of lateral support. A decline like this is simply not going to be arrested until support can be defined. Check, we are at noticeable support.
Finally, what I like to see in a bottom feed is relentless and and dispiriting price action down to said support with bullish divergence by the indicators. We have that in spades with RSI, MACD, CCI and Rate of Change all nicely divergent even as bubble participants give up the ship (fresh lows in price). Right at support. I have included the full Stochcastics which have also diverged but more importantly are on the verge of 'triggering' above 20. That would be another important cross reference to a bullish case.
So there you have it. A simple bottom feed amid terrible price action down to support and bullish divergence. Nothing but NOTHING in this market is 100% and it is all about risk vs. reward. This trade in my opinion has a good risk profile. The risk is certainly better for Natty than back in July, wouldn't you say? I have my own money in this trade and speaking of risk, if the noted support fails so too will the trade and I will book a loss. It won't be the first time. But the key is to always understand your risk profiles and control same.
Edit (10:00) At the time this post was written (pre-market 8/27/08) I was expecting UNG and NatGas to continue hammering out a painful bottom (those are the best kind for sustainability). But during normal market hours we appear to be getting quite excited and gappy. If UNG registers a manic over bought condition directly off of the low I am going to sell it. Please use the above as a chart study on indicator divergence only.

 Its easy to over-think a trade or completely miss profitable trades because you are looking for complex setups. We here at the INO.com like to keep things as simple and profitable as possible. Today we have asked Brian Heyliger of