

There is an interesting opinion that I have read on the web that it wasn’t Trump who put the metals on the rise as many people think, it could be the Chinese huge economic stimulus instead, as shown in the chart below.
Chart 1. China Government Spending, China Interest Rate

Chart courtesy of tradingeconomics.com
I decided to make my own analysis of the price dynamics to check this assumption.
Chart 2. 1-Year Comparative Chart of ETFs and Metals: Synergy Wins!
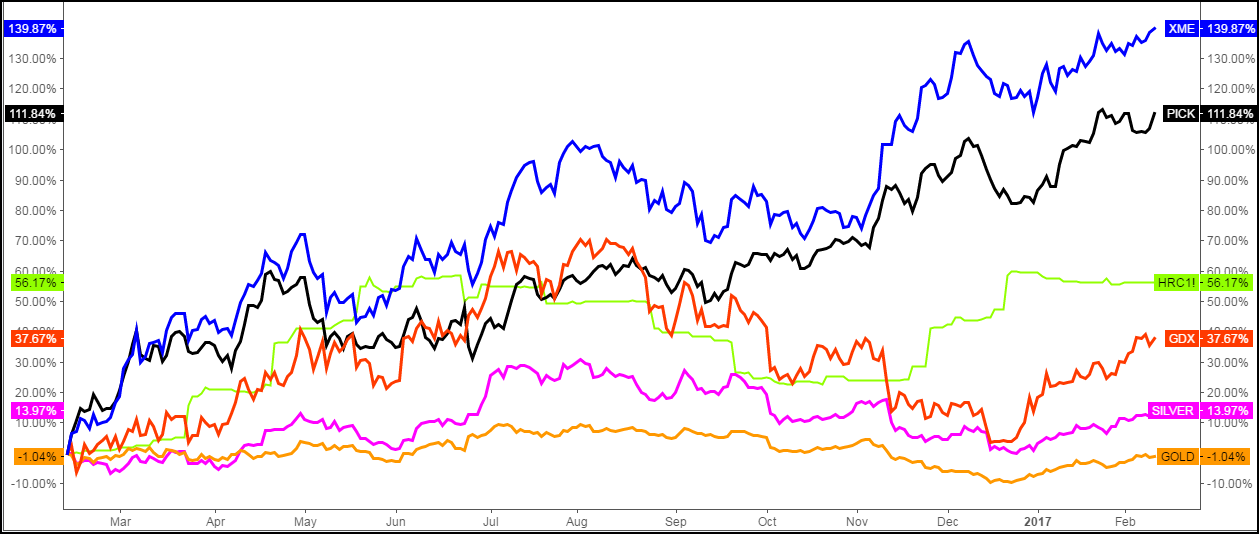
Chart courtesy of tradingview.com
In the chart above, I have combined three ETFs and three metals for clear illustrations of two important things - the first thing is timing and the second thing is the result of the instrument choices.
The three ETFs are:
1. SPDR S&P Metals and Mining ETF (NYSE:XME) (blue) - tracks S&P Metals & Mining Select Industry Index.
(Top Sectors: Steel 44.06%; Precious Metals & Minerals 13.76%; Integrated Mining 12.54%; Aluminum 10.38%; Gold 9.73%; Agricultural Chemicals 4.73%; Coal 3.94%)
2. iShares MSCI Global Metals & Mining Producers ETF (NYSE:PICK) (black) – tracks MSCI ACWI Select Metals & Mining Producers Ex Gold & Silver Investable Market Index.
(Top Sectors: Integrated Mining 40.44%; Steel 35.35%; Specialty Mining & Metals 8.91%; Coal 6.83%; Aluminum 3.38%; Precious Metals & Minerals 2.80%)
3. VanEck Vectors Gold Miners ETF (NYSE:GDX) (red) – tracks NYSE Arca Gold Miners Index. It holds gold and silver mining companies.
The three metals are: Gold (orange), silver (purple) and hot-rolled coil steel (green, code HRC1!).
The ETFs headed to the upside very quickly like top athletes and by the end of last April they had already reached a hefty 40-70% gain. It means that the story of the rise indeed began far ahead of election time and Mr. Trump couldn’t spur such a strong demand for mining sector stocks. I agree that the Chinese economic stimulus launched in 2014 could lead to such a robust growth of the sector as measures taken by the Chinese government are really enormous including rate and reserve ratio cuts and expanding government spending.
Only one ETF finished behind the metal, GDX, which represents precious metals miners, followed the drop in precious metals’ price from the summer peak. It started to gain back some earlier losses only at the end of last year. But it wasn’t enough to beat the steel’s price gain, which scored a significant 56% for one year ranking the third. But anyway, GDX could manage to outperform precious metals’ pale dynamics, scoring a 38% gain versus the 14% of the silver gain and minus 1% of the gold price dynamics. As I once told you, it’s time to think stocks/ETFs not futures.
The second place was taken by the PICK ETF, which represents global “pick” of the base metals mining sector. It scored more than 110%, beating precious metals ETF (GDX) three-fold. This strong demand for industrial metals gives us hope for improving the global economy as I showed you the link between them in one of my earlier posts. And the ultimate winner is the SPDR S&P Metals and Mining ETF (XME), which represents both base and precious metals sectors and also holds coal miners. It gained almost 140% and beat them all. This is called the synergy effect when the cumulative effect of several sectors exceeds the individual sector’s gain.
One thing is obvious from this comparative chart - if you would have bet on the metals’ growth a year ago you could book a nice profit entering ETFs and futures. Only gold lags behind, so leave it to the central banks.
In the chart below I would like to share some thoughts about the leading XME ETF.
Chart 3. SPDR S&P Metals and Mining ETF Monthly: The Last Barrier!
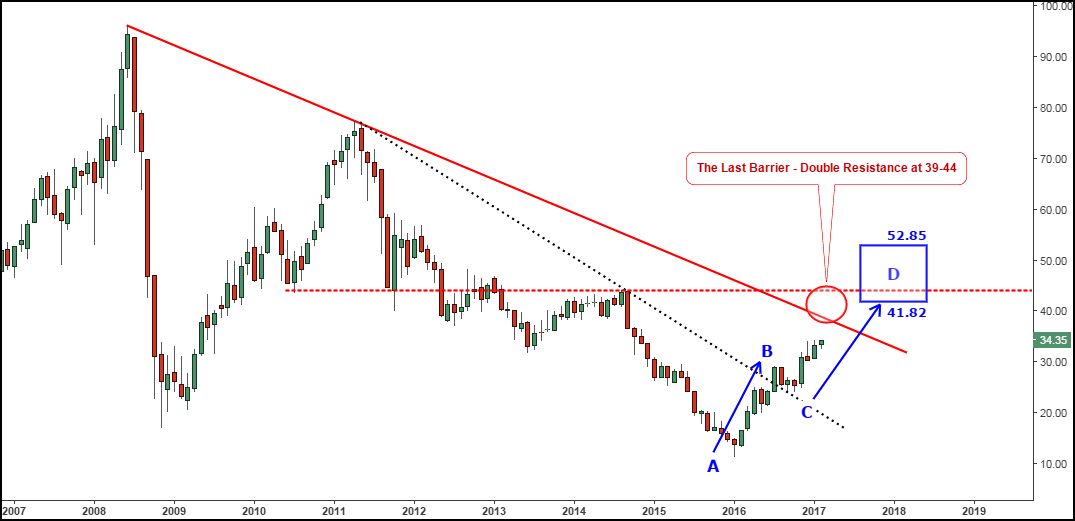
Chart courtesy of tradingview.com
The robust growth of the XME price raises the question of potential global reversal. Last summer it surpassed the first resistance highlighted in black dotted trendline. I tagged that move as the AB segment.
After the pullback to the broken trendline the price started to rise again igniting the CD segment. The targets for this move are set at the $41.82-$52.85 range as highlighted in the blue rectangle. This wide range reflects the possible 1-1.618 range for the ratio between CD and AB segments. There are also intermediate Fibonacci ratios within that range: 1.272 and 1.414. So, be ready to book profit once the price is within that range to sit back and watch if the deeper correction would follow.
There is the last and the very important barrier on the way to the target. It’s a double resistance of the red falling trendline and the red dotted horizontal line representing the former support level. The range for this resistance is set between $39 and $44 marks. If the price would lift of that obstacle, then the global reversal will be confirmed.
Intelligent trades!
Aibek Burabayev
INO.com Contributor, Metals
Disclosure: This contributor has no positions in any stocks mentioned in this article. This article is the opinion of the contributor themselves. The above is a matter of opinion provided for general information purposes only and is not intended as investment advice. This contributor is not receiving compensation (other than from INO.com) for their opinion.
Metals will eventually hit a much Higher Level.