Let us start with the positive news; I spotted a hopeful sign in the silver chart. In my earlier update last month, I anticipated a correction to come in the dollar, gold, and silver charts.
The cleanest retracement among the assets mentioned above appeared in the silver chart as it met minimum requirements. Silver’s price broke below gray support, and the correction almost hit the 38.2% Fibonacci retracement level. It consists of two distinct legs down marked with red numbers. Continue reading "Silver Favor Bulls; Bitcoin To Zero?"→
Polls show that you were optimistic about the probability of another rally for top metals. Both of them go well with the maps that I shared earlier this month. Let's see, in the updated charts below if they are going to justify your bold expectations.
Gold is the first as it has a stronger position now.
Chart courtesy of tradingview.com
The top metal completed the sideways consolidation that I showed you two weeks ago. It didn't touch the 38.2% Fibonacci retracement level at $1636 as it stopped at $1671, which is even higher than the first leg of this corrective structure, which was established at $1661. It is an entirely natural outcome as the last leg down started at $1766, also higher than the top of the first leg did at $1748. The second leg down was longer ($95) than the first leg ($87). Continue reading "Is Gold Poised To Move Higher?"→
Gold is still consolidating as it couldn’t overcome not only the nearest peak of $1766 but it also failed right at the top of the AB segment of $1748. The RSI dipped into the bearish zone below the crucial 50 level. So, it’s the right time to put our classic instrument called Fibonacci retracement level as gold watches ground while both feet are in the air. The first important 38.2% Fibonacci retracement level could offer support at $1636. Continue reading "Gold Falls As Silver Misses Target"→
In this post, I'll go over the charts for palladium, gold and silver, but first I would like to start with palladium futures as it has the most potential gain to reach this round. At the start of May, I shared with you the map with equal opportunities for this champion metal to either break up or down. Here is how you saw the future for palladium in the graph below.
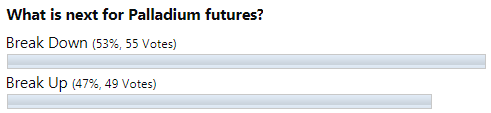
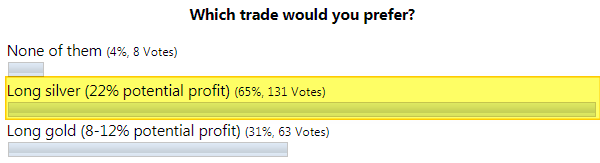
The majority chose the “break down” option, although with a minor advantage, but this bet played out as the metal’s price dipped one more time in the third leg down of a large correction. You were right again!
Now, let’s get down to the hot opportunity that I spotted for you on the palladium futures daily chart as it’s worth watching on the Gold & Silver Primetime.
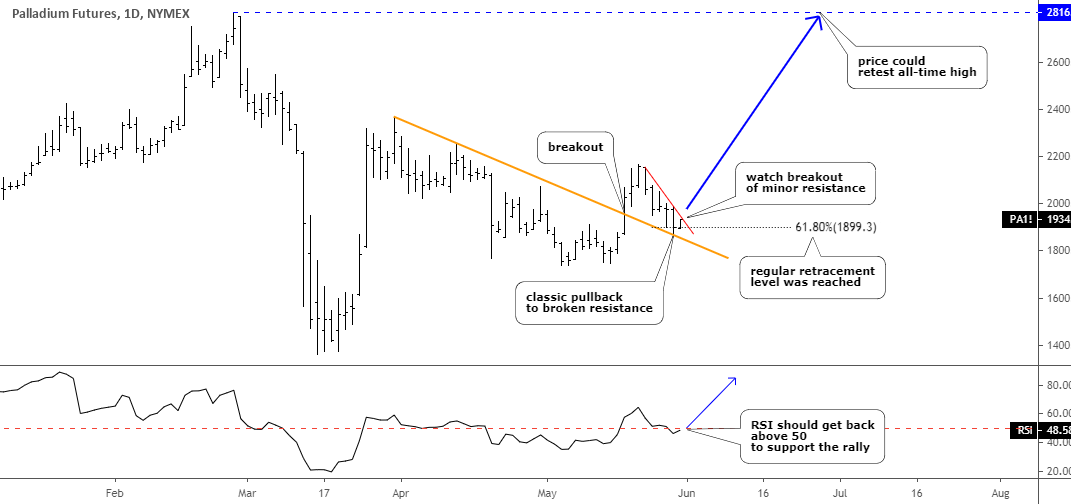
In my earlier post this month, I shared hot trading opportunities for silver and gold. It’s time for an update as we’ve already seen how it played out.
Before we start, I would like to show you the metals performance month-to-date in the graph below.
Chart source: finviz.com
This month silver showed the best performance gaining impressive an +18.15%. The second best wasn’t gold; it’s platinum with a +9.05% gain. Gold is in third place this month, with a +2.39% rise. The most precious of these four metals, palladium, could score only a +1.29% gain.
You were accurate again with your forecast as most of you bet on silver (see chart below) under my last post. Seers in action!