

Back in February, I shared a map for the possible development of a consolidation that started at the end of January in the S&P 500 index. The expected drop followed the post although a little bit postponed.
As top metals are literally dead and still between the confirmation levels these days, I would like to update a lively S&P 500 index chart. For the gauge of American stock market, I prepared two separate charts as it has reached the crucial support and we could have two future options here.
Chart 1. S&P 500 Weekly: Make It Or Break It
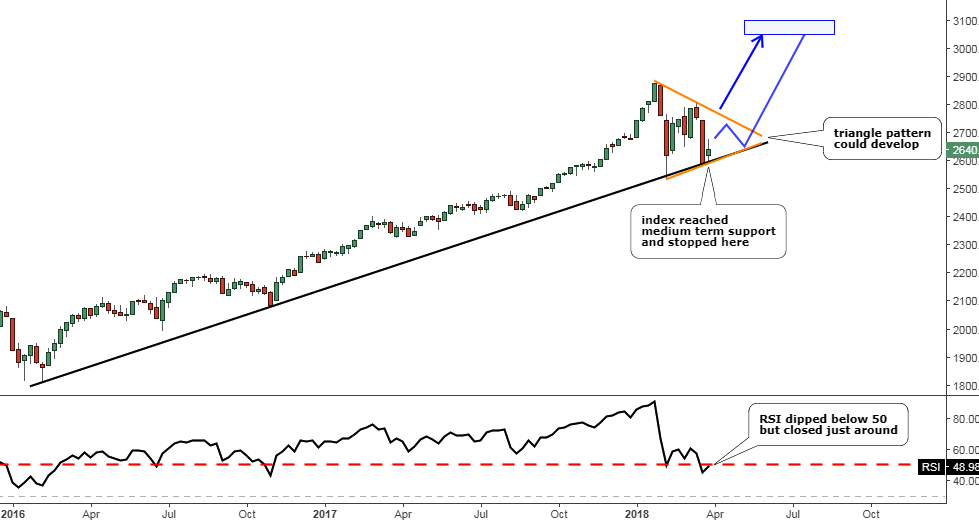
Chart courtesy of tradingview.com
In the monthly chart from my earlier post I added the orange, medium-term support, which I highlighted in black in the weekly chart above. As we can see, that support already stopped the previous drop in February and did it again at the end of March. If the price would freeze at these levels without breaking below the former trough, then the Triangle pattern (orange) could develop as lower highs and higher lows shape it.
There are two options within a Triangle as I highlighted them with a blue up arrow and the blue zigzag. The arrow implies an immediate growth of the index as the zigzag shows short rise and correction before the pattern would be broken to the upside. Therefore the target for the Triangle is set at the two levels between the $3050 and the $3100.
The above said is true for a simple correction as it could be just the first leg of a really complex correction, which is typical for the index. So be careful and avoid excessive greed.
Chart 2. S&P 500 Daily: More Room To The Downside
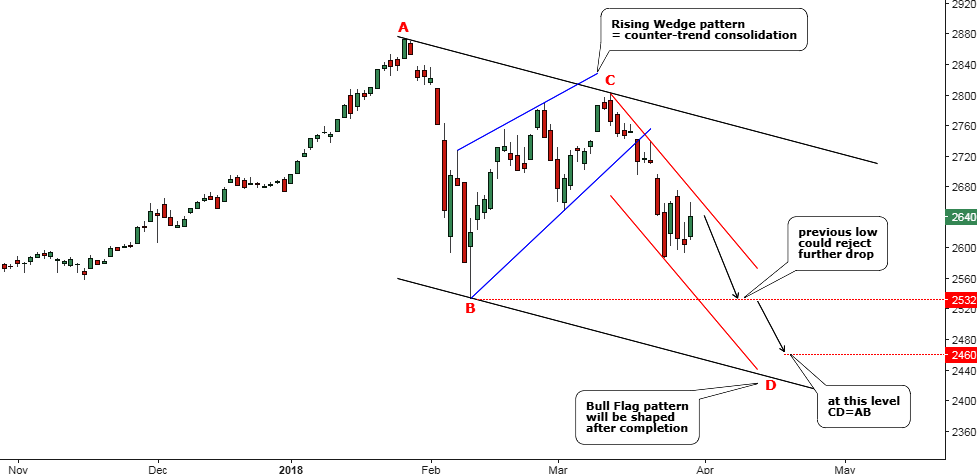
Chart courtesy of tradingview.com
The daily chart above has the lower degree time frame compared to the first one with a focus on the consolidation itself to cut the noise. The angle of the black channel containing the current consolidation is more gentle compared to what I have been anticipating in my earlier daily chart.
The reason for this is the prolonged counter trend consolidation, which has shaped the Rising Wedge pattern (blue) that in its turn worked perfectly sending the price down. The target for this pattern located at the start of it where the former trough has been filled in February at $2532. The price has hit as low as the $2586 so far on the 23rd of March, and there is more room to the downside left to complete the pattern.
The index is descending within a small red downtrend channel and is thought to complete the CD segment, which targets $2460 where CD=AB segment. The see-saw moves started on the 23rd of March shape the tiny consolidation, and we could be in the last leg now, which could touch the resistance of the red channel before the further weakness would emerge. It should be the last leg down as the current consolidation is quite large compared to the whole structure of the CD segment. It should overcome the previous low’s barrier below the $2532 to see the $2460 in the crosshair.
After the completion of this structure within the wide black channel, we would see the Bull Flag pattern on the chart, which could send the index to the upside afterward.
Intelligent trades!
Aibek Burabayev
INO.com Contributor, Metals
Disclosure: This contributor has no positions in any stocks mentioned in this article. This article is the opinion of the contributor themselves. The above is a matter of opinion provided for general information purposes only and is not intended as investment advice. This contributor is not receiving compensation (other than from INO.com) for their opinion.
I know chartist & Elliot wavers are expecting this great run to 3500, but the scary thing is that once the wave 5 3500 run is done that is the end. 100+ years it took to get to wave 5, then the end of the road. Not hearing much about that fact.
Dear Curt,
Thanks for sharing your insight.
I think the reason why nobody is talking about the end of the road is that the wave count is subjective and no one can be sure about the peak as well as about the bottom as even legendary investors lost their wealth betting on foreseen extremes.
In 2008 alone the so called Black Swan could be considered as the end of the road but nowadays you can see that the market is much much higher despite the pessimism.
So many observers called for countless tops at 1500-2000-2200-2300-2400-2500 etc...all passed and over.
Also alternative counts could spoil the picture as you have mentioned only one impulsive count. It could be a complex corrective structure with abc waves one after the other...endless.
And don’t forget that the indices are always change their components. Weak names are out...rinse and repeat.
I think 2700~2725 this week
Dear Rolando,
Thank you for your time to stop by and share your view.
Let’s see how it goes as I see now only minor consolidation after the good drop.