

As promised in my earlier post I updated the silver chart for you in this post as I spotted some exciting patterns forming on the chart below. But first, I would like to start with the stronger of the two metals, gold.
Chart 1. Gold Daily: Couldn’t Tag Previous Top
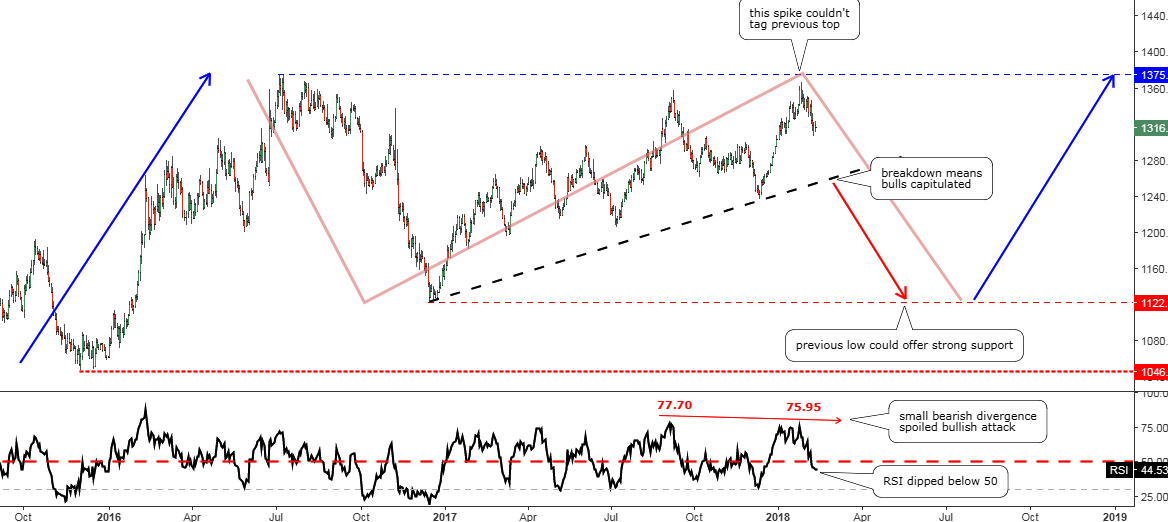
Chart courtesy of tradingview.com
Indeed, it was another excellent try when the bulls attempted to break loose from this long-lasting range established between $1046 and $1375 in 2016. But the RSI indicator didn’t agree as lower tops showed a hidden Bearish Divergence and this spoiled this nice bullish attack. The $1375 resistance has been left untouched. Moreover, now this strong indicator indicates that the bears took the ball as it dipped below the crucial 50 level.
What’s next? As there is no significant change to the range’s map, then we should be prepared to the old and straightforward market strategy, which says sell into range top and buy on the dips to the range trough. Gold couldn’t break up the top, and therefore we could see substantial selling pressure ahead. Bulls could finally capitulate once the price breaks below the black trendline support in the $1250-1255 area. Bears could push the price down until it reaches the previous low at the $1122 where strong market support could appear as historically it was proven tactics to buy there as the market reversed.
Chart 2. Silver Daily: On The Edge
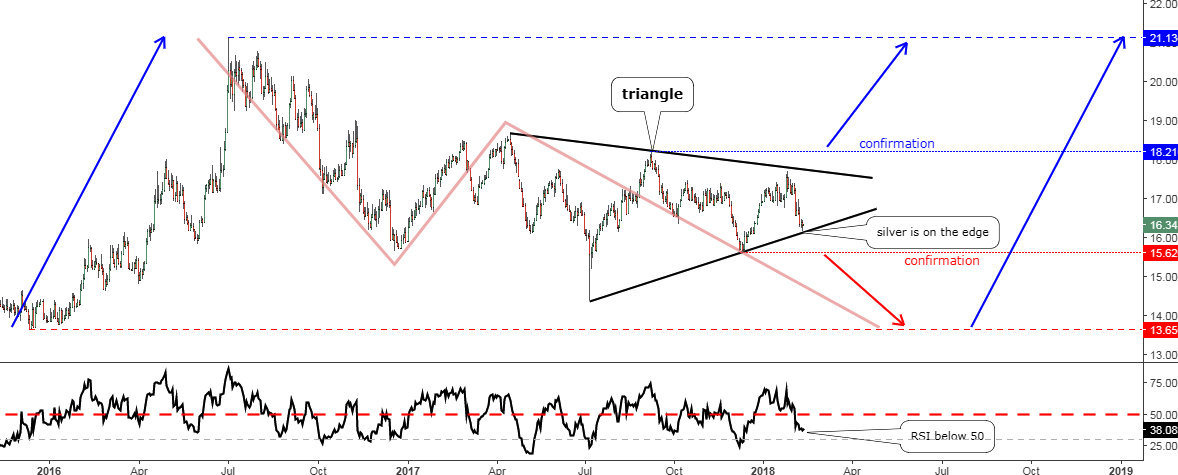
Chart courtesy of tradingview.com
The sudden Flash-Crash that ditched silver occurred last summer, and that’s why its chart structure differs considerably compared to gold as central banks, and other market whales have a presence there and would protect gold from such misbehavior.
No threat ever appeared to the former top established in 2016 at the $21.13. Instead, silver bulls have tried to survive pushing the price to the upside as much as they could, but every other attempt has failed at lower and lower levels shaping falling tops on the chart. At the same time, troughs were also ascending, and this created the famous Triangle pattern (black).
The metal finished last week just two decimals away from the Triangle’s support edge located at $16.10. The RSI already dropped below the 50 level, and this isn’t helping the bulls. The break below the previous low inside of the triangle at $15.62 will confirm a further fall. Market weakness could bring the price to the Flash-Crash trough at the $14.39 mark. A Further breakdown would aim at the range’s bottom at $13.65.
If the price could surpass the $18.21 mark, there is a chance for a bullish continuation until the major top at the $21.13 level.
Now I would like to share with you some significant insights.
Last July I showed you my vision for the current range of a complex correction in both gold and silver. Nothing has changed to that global outlook and to cut the noise of the price fluctuations I added blue up arrows showing both main legs of this correction and pink zigzag down showing the counter-trend connection of these two blue up arrows. As I told you many times before, market consolidations could last longer than someone’s nerves as opposing market forces struggle with each other in this area and of course, it takes time to reveal the winner.
Intelligent trades!
Aibek Burabayev
INO.com Contributor, Metals
Disclosure: This contributor has no positions in any stocks mentioned in this article. This article is the opinion of the contributor themselves. The above is a matter of opinion provided for general information purposes only and is not intended as investment advice. This contributor is not receiving compensation (other than from INO.com) for their opinion.