

At the end of last month, I called for a substantial upcoming weakness in crude oil as the market could have finished the long-lasting consolidation after the earlier crash from 100+ levels. Indeed, oil lost almost $4 from that time and now is rebounding as markets naturally move in zigzags.
Oil-related currencies also suffer, and in this post, I would like to share with you an exciting chart setup with tremendous profit potential for one of such currency, the Canadian Dollar (CAD) also known as “Loonie” among traders.
Before that, I built a chart to demonstrate the correlation between WTI crude oil and the Canadian Dollar.
Chart 1. WTI futures Vs. Canadian dollar futures: Perfect Correlation
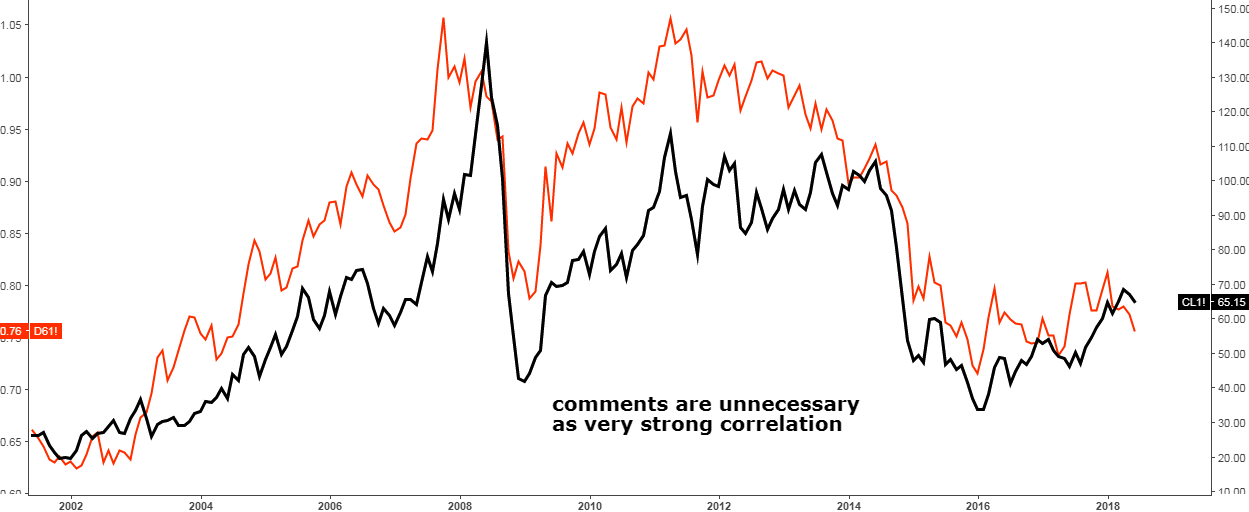
Chart courtesy of tradingview.com
In the chart above the WTI futures graph is black on the right scale and the Canadian Dollar futures graph (in US$ per 1 CAD) is red on the left scale. I didn’t add any annotations on the chart as you can clearly see that the correlation is just perfect and the most important fact is that the crucial market phases like strong moves and consolidations coincide in time. The Canadian Dollar tends to overshoot WTI amid market strength, but it is quite moderate during market weakness.
In this chart, we can see that the consolidation in the Loonie peaked a little bit earlier than in WTI and now it is going to move to the south again.
So, after we witnessed the strong influence of crude again upon the CAD, we could get down to the chart of the Loonie where I detected the strong signal for you.
Chart 2. Canadian Dollar Futures Monthly: The Bear Flag You Don’t Wanna Miss
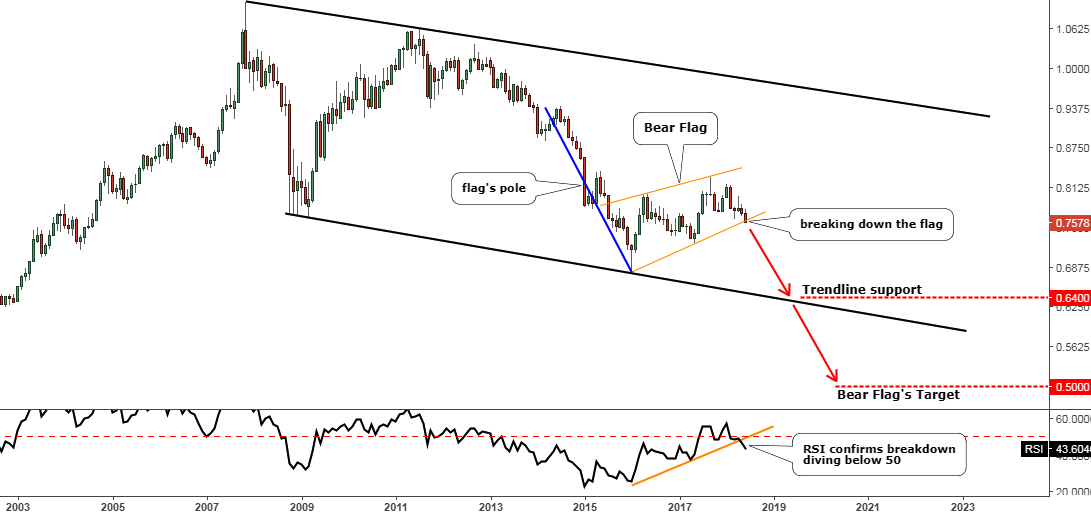
Chart courtesy of tradingview.com
The Canadian dollar futures are in a 10-year downtrend channel (black). The considerable drop started in November of 2017, which was relatively shorter in time compared to the long-lasting drop initiated in 2011.
After it, from 2016 the CAD paused within a significant and easily distinguishable consolidation. I highlighted it within slightly converging orange lines, which shaped the Bear Flag pattern. The pole of this flag is highlighted by the blue line.
As you can see for yourself, the price has been penetrating the downside support of the flag, which signals the end of the consolidation. Then the follow-through selling pressure should emerge, pushing the Loonie lower against the US Dollar. On top of that, the RSI indicator confirms this breakdown as it breached the trendline support by diving below the crucial level of 50.
There are two possible targets for this short setup. The first one is located at the downside of the black channel at 64 US cents. It is below the earlier bottom tagged on at 68 US cents. Although it’s the nearest target, there is still an enormous profit potential of around 15%.
The second target is calculated by the pattern rules for the Bear Flag and is located at 50 US cents (the length of the flagpole was subtracted from the breach point). This is a very ambitious aim with more than 33% gain potential!
Intelligent trades!
Aibek Burabayev
INO.com Contributor, Metals
Disclosure: This contributor has no positions in any stocks mentioned in this article. This article is the opinion of the contributor themselves. The above is a matter of opinion provided for general information purposes only and is not intended as investment advice. This contributor is not receiving compensation (other than from INO.com) for their opinion.
It is not a perfect correlation. Please refrain from using the term unless you are going to undertake a statistically relevant analysis and provide the results. They appear similar to be sure, but it's far from perfect.
Are you are suggesting that oil will go down from here, and therefore the CAD with it? I ask because a lot of other specialists suggest that USD will go down and resultantly oil up. And given the correlation between oil and CAD you claim, then CAD to should move up with oil.
Dear Bharat, thank you for your question.
My answers are in the brackets below.
Are you are suggesting that oil will go down from here, and therefore the CAD with it?
(Overall my outlook for WTI for medium and long term is bearish https://www.ino.com/blog/2018/05/oil-could-crash-again/.
As I said in the post the consolidation in the Loonie peaked a little bit earlier than in WTI and moreover it already broke below the support of the flag. This is why I posted this piece to signal it.)
I ask because a lot of other specialists suggest that USD will go down and resultantly oil up. And given the correlation between oil and CAD you claim, then CAD to should move up with oil. (I respect different opinion as I shared only mine)