
There is an age-old question asking: How do you determine if a trader is biased? Show him a chart and ask where he thinks the market would go and then show him the same, but reversed chart and if the answer is the same, then this trader is indeed biased. We call such a trader a Perma-Bull or a Perma-Bear. The market sentiment is often split even as there are a lot of biased traders and market is then trapped within a range as there is no dominant opinion among the participants.
Every day I see how the trading community spreads opposite signals in any instrument creating an overwhelming sea of information where it’s hard for novice traders to focus and make a trading decision. Different levels of experience and fantasy generate the diversity of chart patterns and models. People change time frames and squeeze or expand charts; all of this affects the perception and therefore, the final decision.
Let’s perform an educational experiment with two patterns that I found on different time frames for the same instrument, copper. I will add two separate charts with those patterns followed by explanations. I am eager to see what you think about the outlook for this instrument after reading and voting on the pole at the end of the article.
Chart 1. Copper Futures Quarterly: Head and Shoulders?
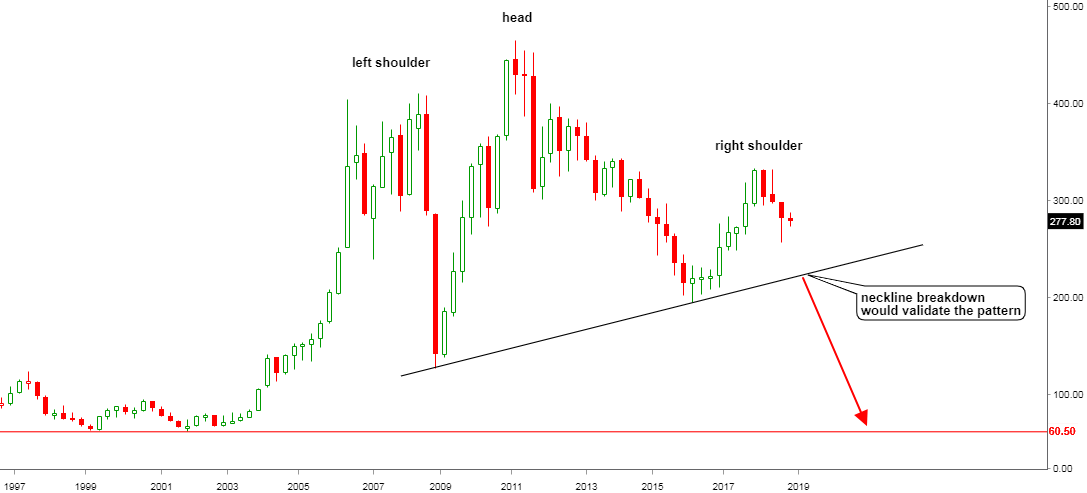
Chart courtesy of stooq.com
On the quarterly chart, there are three tops located on different levels, and the central peak is the highest. This sequence usually shapes the Head and Shoulders reversal pattern. The main focus should be on the black Neckline, which is drawn across the bottoms of the Left Shoulder and the Head. The pattern will be validated on the breakdown of it around the $2.2 level.
The height of the Head is too large to apply it on the breaking point of the Neckline to measure the downside target, according to the classic rule, it will be a negative number. Instead, I set the base, where the strong move up started, as a target at $0.6 level (price scale is in US cents).
It is a Bearish pattern with a catastrophic outlook for copper. Now let’s see the model of the opposite view below.
Chart 2. Copper Futures Monthly: Triangle?
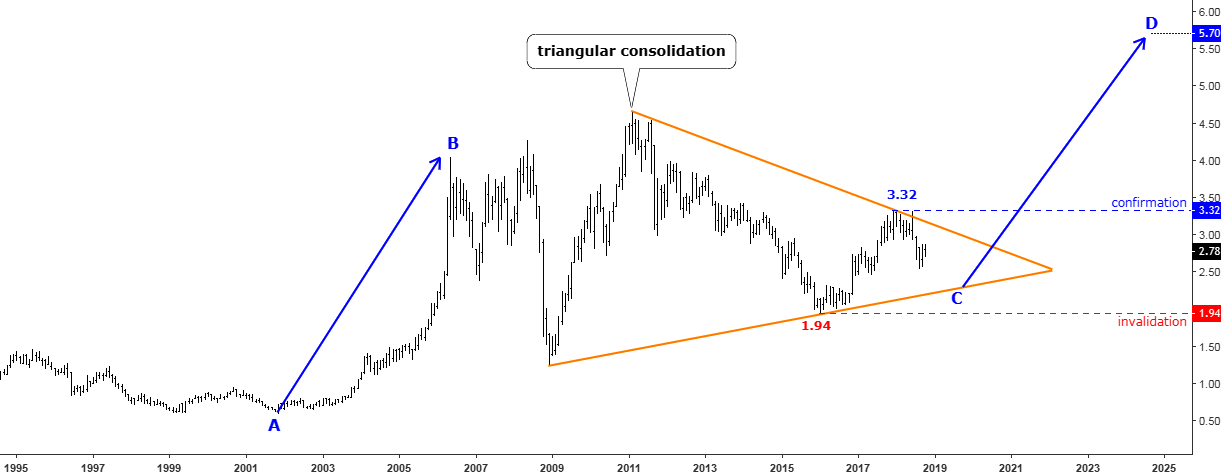
Chart courtesy of tradingview.com
On the monthly chart above one can see the same pattern, which I highlighted with orange converging lines for you. It is a Triangle, which represents a large consolidation and acts as a junction between the AB and CD blue upward segments.
It’s ironic that we should watch the same downside support that was a Neckline on the first chart as the price could dip there, but this time, given the bullish bias of this model, we would expect the copper price to bounce off it.
The target is set near $6 at the $5.7 level where the CD=AB. The confirmation would come with the breakup of the former top beyond $3.32. The invalidation will be triggered on the drop below the earlier valley of $1.94.
This is a Bullish model as the price would more than double.
If neither model is right for you, please comment below sharing your view/link as every single opinion matters.
Intelligent trades!
Aibek Burabayev
INO.com Contributor, Metals
Disclosure: This contributor has no positions in any stocks mentioned in this article. This article is the opinion of the contributor themselves. The above is a matter of opinion provided for general information purposes only and is not intended as investment advice. This contributor is not receiving compensation (other than from INO.com) for their opinion.
More illustration using arrows & straight lines are needed for making the H&S criteria!
I haven't made precised study so right i just cant guess any specific target, however, ultimate impact of trade war may reflect in chart and it may be affected considerably on this issue so any Lower targets cant ruled-out so far.
If it were $0.06 per Shair. L would one 100 shairs.
I prefer higher high higher low so I'm bullish for now
LME copper stocks are down from 350,000 tons to less than 160,000 tons in the last 6 months.COMEX stocks are also dissipating quickly.At this rate there will be a squeeze on copper in the next 2 months.Copper price usually rises in the 4th quarter?I see copper at 4$ in early 2019.
El triangulo que muestras no es de consolidacion, es un triangulo de incertidumbre porque se pueden dar las dos opciones, de subida o bajada. Un triangulo al alza es cuando se mantienen los maximos en una linea de tope y lo mas probable es que se dispare el precio al alza al llegar al vertice e igualmente un triangulo a la baja es cuando se mantienen los minimos en una linea de resistencia y lo mas probable es que se caiga el precio cuando el valor se aproxime al vertice del angulo.
"The triangle you sample is not consolidation, it is a triangle of uncertainty because you can give the two options, up or down. An upward triangle is when the maxima are held in a top line and it is most likely that the price will rise upwards when reaching the vertex and also a triangle to the downside is when the minimums are maintained in a line of resistance and the most likely is that the price falls when the value approaches the vertex of the angle." - Translated using Google Translate
What an interesting exercise! I can see BOTH possibilities but I can't choose and here's why: It will likely take 12-18 months before before copper reaches the neckline (also the lower support line of the triangle) and I simply cannot see that far into the future to know what copper will do at that point. It could go either way, and a large influence on what copper does will be the business cycle -- is business good or bad? "Dr. Copper" is often a reflection of the general business climate, so I would wait and see what business conditions are like when we get closer to that neckline.
In either case. Would you consider a pattern of lower highs and lower lows, ergo bearish.