
Two weeks ago I put the spotlight on copper as I found there was a nice trading opportunity in the making. The trigger for the short trade was set at the $2.75 (below minor low) to avoid emotional trading or simple guessing, and it paid well as the price dipped from the $2.84 area and stopped 2/10 of the cent above the preset trigger. Then the price reversed much higher as I expected as it should retest the former top of $2.87 before it finally goes down.
We call it a trade setup. Before that, we had an idea, which was based on some kind of analysis. So, converting good ideas into profitable trades makes us better traders. Add patience, discipline and some sort of trading strategy to get consistent profits. Otherwise, a good idea could remain to be just a good idea without pleasant outcomes for us.
Let me show you in this post how I would trade this copper idea on the short side step by step.
Step 1. Chart Analysis: Copper Futures Daily,
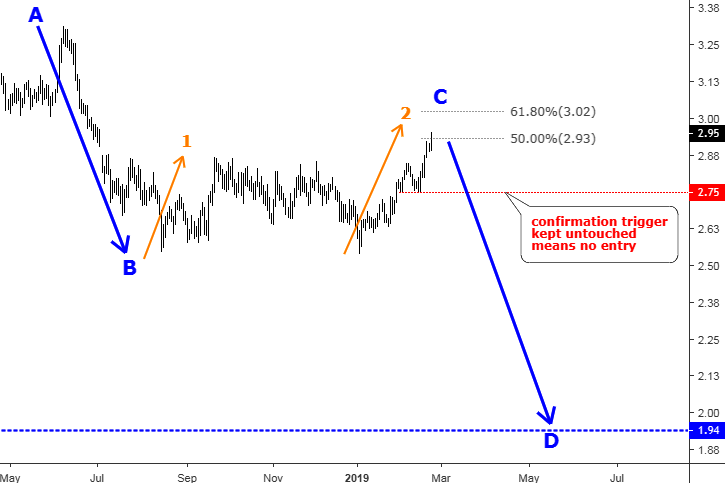
Chart courtesy of tradingview.com
So, my analysis shows that the copper price is in a large correction, which has been building the last leg to the upside (orange up arrow marked as 2). This leg is already 1.3 times longer than the first orange leg up. The price has retraced half of the preceding AB move down crossing the $2.93 mark to the upside. The next Fibonacci retracement level is at the $3.02 level (61.8%).
Step 2. Trading Idea
The idea based on the above analysis is to make a profit on the potential huge drop, which should follow after the completion of the entire correction. The idea shows which way we would like to play.
Step 3. Tailoring A Trade Setup
We should prepare a Sell Setup to enter the trade using specific entry, stop and take profit levels. These are the things that make a trade. If you don’t have all three levels in your mind, you better avoid trading as it would become a mere gamble.
Identifying Entry Level: Copper Futures 1H Chart
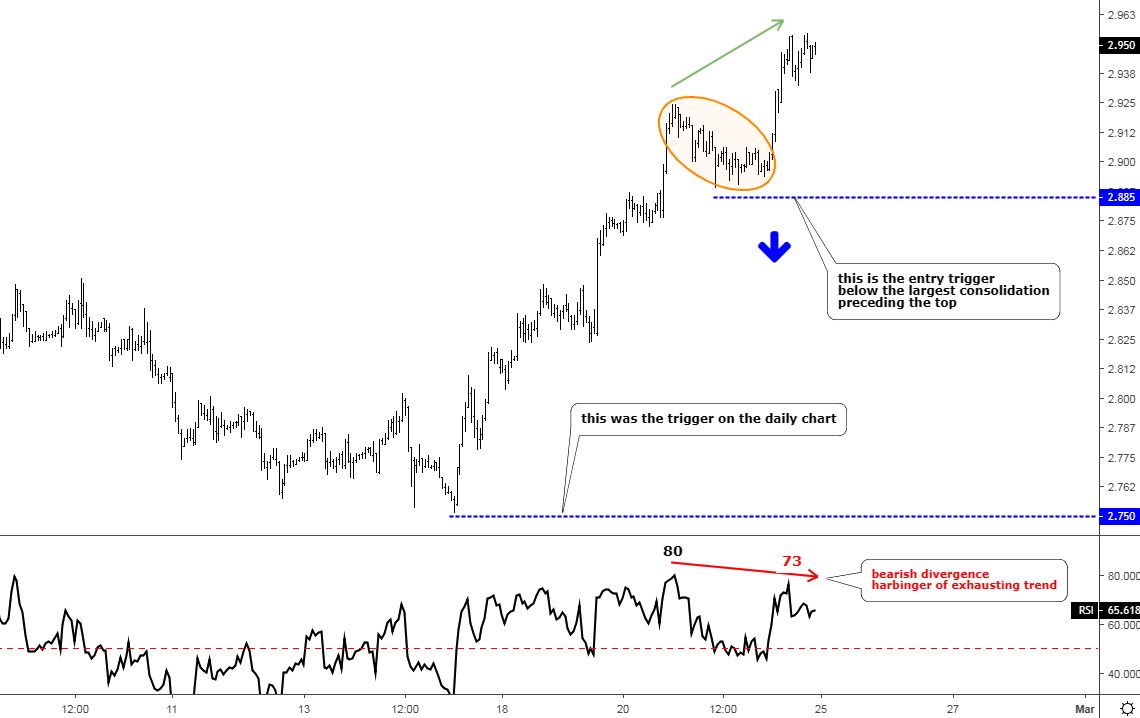
Chart courtesy of tradingview.com
As I mentioned above, the price dipped from the $2.84 to the $2.75 level and then reversed to the upside without triggering a sell entry. We should focus on that very move. It was very strong as the angle of the upmove was very sharp.
The RSI moved above the crucial 50 level with the rising price, and we can see that it has topped at the 80 level on the 20th of February. But if you look at the price chart the move up nevertheless continued and the copper price printed a new high slightly above the $2.95 level (green arrow) despite that the RSI has built a lower top at the 73 level (red arrow). This contradiction between price and indicator is well known, and it is called a Bearish Divergence. This is what I was searching for when I switched to the 1-hour chart.
For me, it means that the uptrend should exhaust soon as the time frame is small. The sell entry order should be placed below the valley of the largest consolidation ahead of the top where the divergence occurred. In our case, it is at $2.8890. So, I would sell copper several fractions of a cent below that level, say at $2.885.
This approach already worked well as earlier we should sell below $2.75, now below $2.885. If the price will make another consolidation and after that, it will hit a new maximum, then we should move the sell entry higher using the same rules as I described above. Rinse and repeat until we get the highest triggered entry. No guessing!
Setting the Stop Loss
The pain is the part of the game as we are only humans and we can be wrong. To limit our risk, we should exit the position according to our trading strategy. I would set the stop-loss order slightly above the highest top ahead of the breakdown of my trigger. Currently, it should be placed above $2.955, but it could change before the entry order is triggered.
Target
The target was set as I showed it before in my earlier post and the daily chart in step 1. The recent low of $1.94 is the main target so far. But never forget one wise thing – any profit is a profit, which perfectly matches with another one – lose a chance, not your money!
Risk/Reward Ratio
Your planned profit should exceed predetermined risk; otherwise, there is no reason to trade as statistically even if half of the trades are winners you would end up losing your account.
Our risk expressed in price difference if we put a stop loss at the $2.985 against the entry of $2.885 is equal to $0.10.
Our potential profit is equal to $0.945 ($2.885 - $1.94).
Then the risk/reward ratio is equal to 9.45, which is much better than the industry recommended ratio of 2-3.
Step 4. Risk Management Matters
After we know when to enter and when to exit our planned position we should identify the size of the position. For me, first of all, it means to risk only 1% of my account on each trade.
Here is an example: let’s assume someone has $100 000 (for easy calculation) on the account. 1% of it is equal to $1000. The entry is at $2.885.
The stop is at $2.985.
The potential risk is equal to $0.10 (2.985-2.885).
Risking 1% here means $1000 (1% of the account)/$0.1 (risk) = 10 000 lbs. of Copper (1 E-mini futures contract = 12 500 lbs.)
We should always remember that we can’t control the market as we can only manage ourselves and limit our risk!
Feel free to comment on this setup and share your thoughts/links to exchange views for mutual benefit.
Intelligent trades!
Aibek Burabayev
INO.com Contributor, Metals
Disclosure: This contributor has no positions in any stocks mentioned in this article. This article is the opinion of the contributor themselves. The above is a matter of opinion provided for general information purposes only and is not intended as investment advice. This contributor is not receiving compensation (other than from INO.com) for their opinion.