
Last July I posted a monthly chart of copper futures to show you that the earlier move up had been completed when the price hit the accurately predicted $3.32 level and we have entered a bearish mode.
The big short game was set between the $3.32 and $1.94 extremes. The earlier post was calling for the price of copper to retest the former valley of $1.94. Below are the poll results with your expectations recorded in July of 2018. Again, I am very thankful for your stable activity!
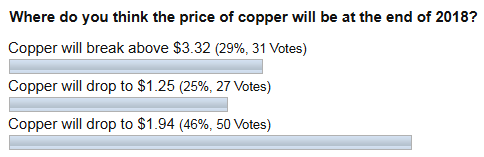
The majority of you agreed with my opinion that the copper could revisit the former low of $1.94. 2018 finished at the $2.64 mark, which is far away from the target and below I will show you why and what could be the next for copper.
Chart. Copper Futures Daily: Another Chance For Bears
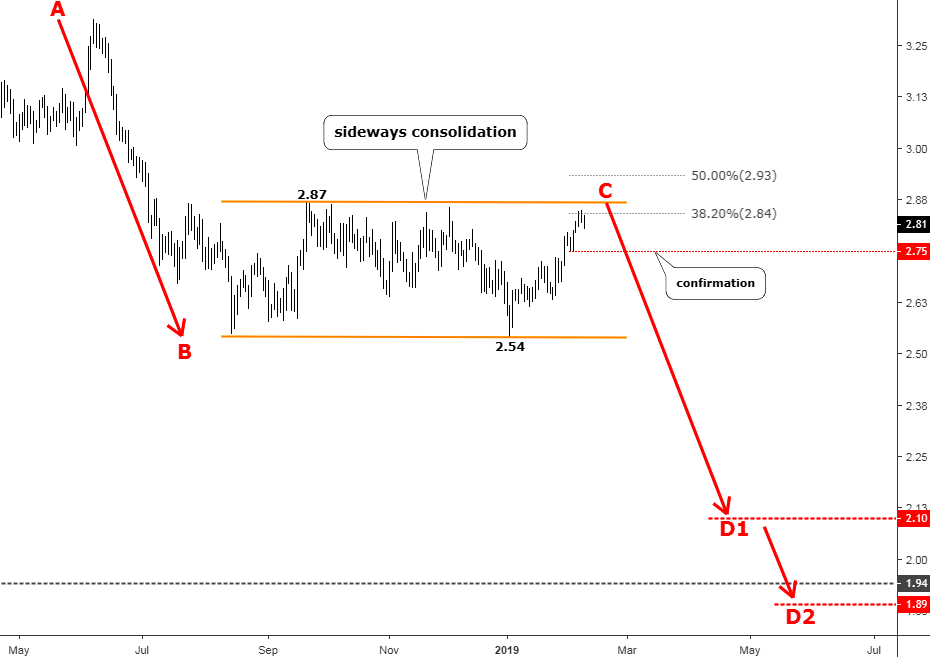
Chart courtesy of tradingview.com
In this post, I switched to the daily time frame to focus on the first drop from the top and the following consolidation as earlier posts were based on the monthly time frame to show the bigger picture. In my previous post I recommended not to chase the falling price as there should be some kind of correction to have better risk/reward parameters. And those who had the patience to wait for that advised opportunity can now take a chance from another huge drop of the copper price.
I highlighted that predicted sideways consolidation with the orange flat parallel channel between the $2.54 and $2.87 marks. Copper couldn’t push the price much higher to build the deep correction as it stopped just above the first Fibonacci retracement level of 38.2% located at the $2.84. It means that the next drop will be strong as the market doesn’t buy the metal’s temporary strength. Another spike higher is pending to tag the former top of $2.87 to complete the consolidation as last Thursday the copper price only hit the $2.85 mark. I highlighted the $2.75 level of the previous minor low to set the early trigger for a future reversal.
Now let’s set the target area for the anticipated drop. The first colossal drop was labeled as a red AB segment; it scored 77 cents. The upcoming weakness is labeled as a red CD segment, and there are two D points set. The D1 was measured with equal distance of AB segment, and it is located at the $2.10 mark. But that is not enough to hit the former valley of $1.94. Therefore, we should add another target at D2 point, where the next Fibonacci ratio of 1.272 is used. It is located at the $1.89 mark. These D points are preliminary as we should wait for the pending last spike to touch or slightly break above the $2.87 level of the former top. Then we should adjust our targets accordingly using already measured distance of AB segment (77 cents (D1) and 89 cents (D2)) subtracted from the actual C point.
The current chart structure predicts not only the weakness of copper but also the fragile situation in the global economy, which is undermined by trade wars and future uncertainty as copper is one of the major elements of global infrastructure.
This daily chart above illustrates very well what I am always talking about when I mention the tricky and time-consuming nature of market corrections. The AB segment unfolded in a short period of 69 days, but the subsequent consolidation that consists of 9 zigzags!!!, already took 177 days of our precious life to emerge, which is more than two times longer than the drop it retraces.
So, I advise you to save it at least in your memory as this rule works on any time frame.
Intelligent trades!
Aibek Burabayev
INO.com Contributor, Metals
Disclosure: This contributor has no positions in any stocks mentioned in this article. This article is the opinion of the contributor themselves. The above is a matter of opinion provided for general information purposes only and is not intended as investment advice. This contributor is not receiving compensation (other than from INO.com) for their opinion.
Point to be consider is, Copper is key industrial material, if it seems bearish? what can we expect about overall performance of Industries / Economies? is it not looking like a red signal?