Last week I promised to the reader who commented on the dollar index’s strength under my silver post, that I would write a separate piece about the king currency.
Here we are, and I will start from the very long term chart, and you will see why I answered in my comment that it all depends on which time frame we are looking at as these days as the dollar index is falling. Should we worry about it?
Chart 1. Dollar Index Futures Quarterly: Correction
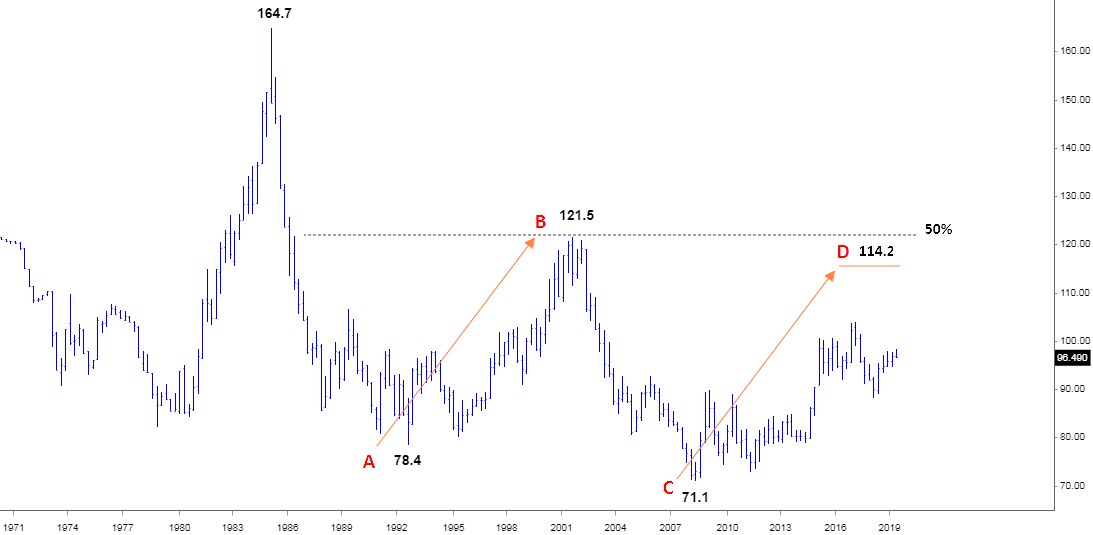
This is a long-term view of the dollar as almost 50 years passed since 1971. For the whole period, the maximum price was established in 1985 when the dollar index hit 164.7. After that, it dropped like a rock down to the 78.4 in 1992. And then we can see a huge correction that had reached exactly a 50% Fibonacci retracement level at 121.5 in 2001. That strength of the dollar turned out to be short-lived as another drop followed. This time it had fallen much faster as it quickly reached the former trough and after a small consolidation, the index slid further down to a new four-decade low of 71.1 in 2008 amid the financial crisis.
It looks like we are in the second leg of this huge corrective structure, and the first leg (AB) was deep enough. This structure is slightly complicated as the start point (C) is located lower than the A point. This could result in lower D point if CD segment expanded to the distance of the AB segment. I highlighted it at the 114.2 level for you to have a visual orientation on the chart above.
Sometimes the second leg of correction could reach the top of the first leg, and then we could see the dollar index hitting the 121.5 mark again. I am eager to see your comments below what should happen in the world to cause such a huge demand for the ultimate currency?
Such a big projected strength of the dollar would put huge pressure on the precious metals. And I am not surprised as I repeat every time that we are in the large complex correction in the metals, another drop will follow the current strength. There is no mismatch for me here.
Again, even if the dollar will be so strong in the second leg, we shouldn’t forget that it is still a correction before another huge drop of the dollar index after that.
I would like to go deep into the current move up in the next chart to share with you more details.
Chart 2. Dollar Index Futures Monthly: Looking For Similarity

Chart courtesy of tradingview.com
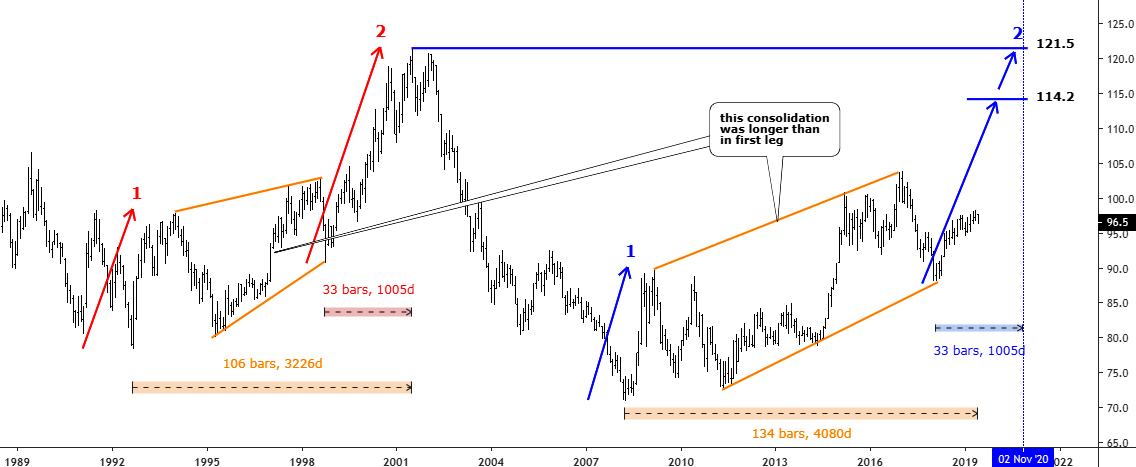
The first leg could often be a model for the second leg of correction. I measured the date ranges of both legs and the second leg is already much longer than the first leg: 134 bars (months) vs. 106 bars (months). To find out the reason for this I have split both legs into lower degree two legs each with corresponding labels. There are intermediate consolidations (orange trendlines) inside of each leg. Now, after we see the clear structure of each leg, there is an answer why the second big leg lasts longer – the intermediate consolidation in the current leg is way longer than the first leg.
Then how to find out when the second leg will finish? Let’s try to focus on the second red up arrow of the first leg, which was 33 bars (months) long. I think it’s the right approach as we should skip intermediate consolidation, which could vary and become long lasting and quite complex. So, I added that period to the start of the second blue up arrow and the time target appears to be in November 2020, so we have more than one year to complete this current move up.
The invalidation point of this structure is located at the start point of the second blue up arrow below 88 mark, which is too far from the current level.
Intelligent trades!
Aibek Burabayev
INO.com Contributor, Metals
Disclosure: This contributor has no positions in any stocks mentioned in this article. This article is the opinion of the contributor themselves. The above is a matter of opinion provided for general information purposes only and is not intended as investment advice. This contributor is not receiving compensation (other than from INO.com) for their opinion.


The president’s tweets on the USD have the potential to have much more lasting impact in the coming election year. Thanks for sharing great article.
the dollar is set to take off when euro zone have problems, every one there want safe dollar IMO go to 100 then 114/115
Some times you just need to live longer but history does repeat.
The dollar is set to take off when the global economy goes into serious contraction mode, putting pressure on dollar denominated debt, and forcing debtors to buy dollars to try and pay back that debt, before they ultimately fail. When the real defaults start piling up the dollar will reach its high, then drop like a rock thereafter, as dollars will no longer be in high demand. Right now its treading water, waiting. Waiting. Waiting....