
Today, we are writing about a pattern that our research team sees in the Gold/Silver ratio which is correlated to the price movement of Gold. What does this mean and how can we profit from this setup? Let’s get started trying to explain this chart pattern/setup.
Gold/Silver Ratio Chart From A New Angle
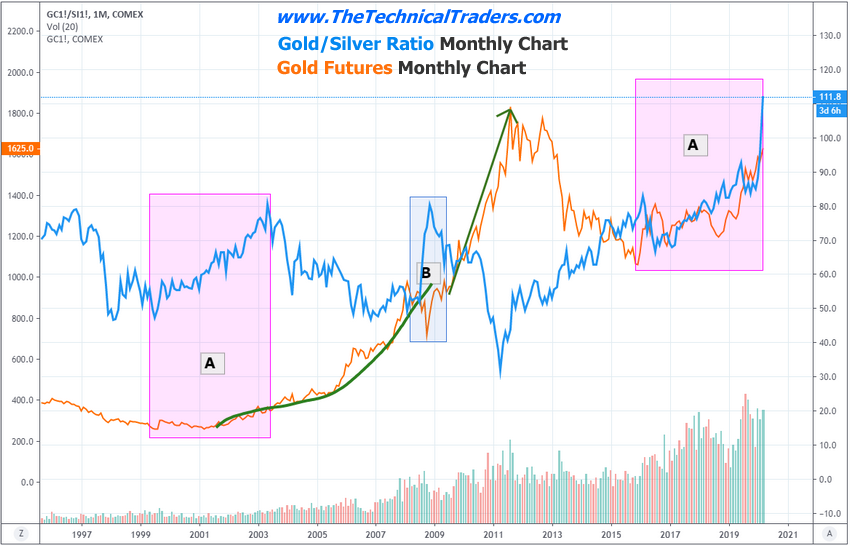
This first chart highlights the pattern we have identified and how we believe a similar pattern is setting up again in the current market. The setup of the pattern is explained in the text below, but quickly scroll down and look at the first chart and the pink shaded areas “A” to get an idea of what we are talking about.
Prior To “A” Pattern Setup
After a moderate price decline in Gold (1996 through 2001), a bottom sets up as the price of Gold begins to base near support.
The Gold/Silver ratio (BLUE), falls throughout this pattern setup as both Gold and Silver prices decline somewhat in unison.
The Setup “A”
Gold prices begin to rally moderately while pushing the Gold/Silver ratio higher over an extended period of time (from 1999 to 2003: about 4 years).
The Gold/Silver ratio peaks and begins to decline in mid-2003 as the price of Gold continues to rally at a bit more accelerated rate.
Gold prices begin a parabolic upside price advance in early 2006 after the Gold/Silver ratio collapses about 18% to 20% from the peak level near 82.50.
We believe a similar type of pattern is setting up right now in the metals market and we believe both Gold and Silver will engage in a price advance over the next 10+ months that may be similar to the post-A set up in mid-2003. If you are familiar with what happened in the metals market at that time, Silver began to advance at a faster rate than the price of Gold advanced.
This is what caused the Gold/Silver ratio to begin to collapse.
Silver Monthly Chart From 1993 To 2004
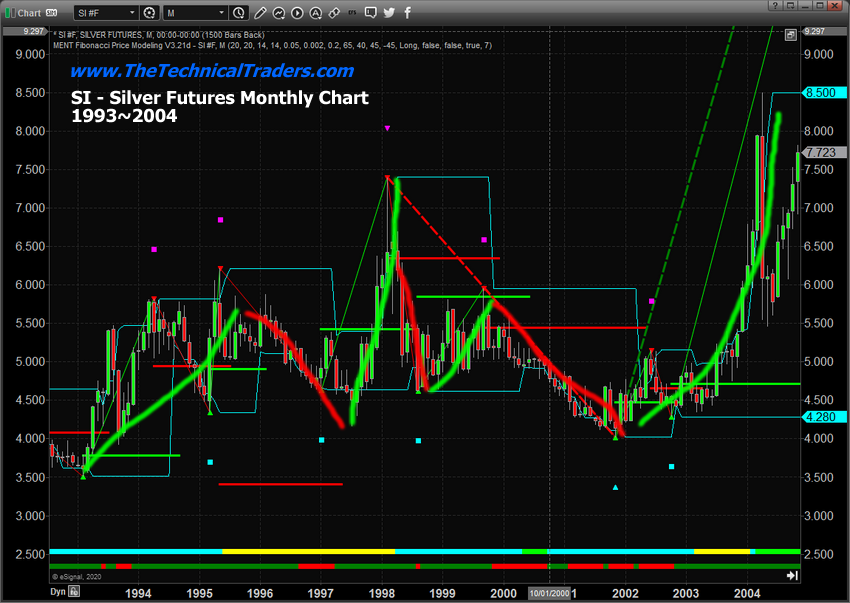
This Silver chart from 1993 to 2004 clearly shows how the price of Silver was reacting throughout the setup prior to “A” and after “A” in the chart (above). Silver began a moderate price advance in 1993 from a level near $3.50 and advanced to a level near $7.50 in 1998. Then, it began a downside price move to reach new lows in 2002. At that point, the markets changed. Gold and Silver began to advance almost in unison with Gold still advancing slightly more than Silver until early/mid-2003. Once Silver broke dramatically higher, in late 2003-04, the Gold/Silver ratio started breaking downward instead of upward. This is the pattern we are seeing in the metals market right now.
We believe the recent rotation in the metals market and the dramatic price divergence between Gold and Silver are setting up another similar type of pattern that could prompt both Silver and Gold to rally upward from current levels by at least 200%.
Current Silver Monthly Chart
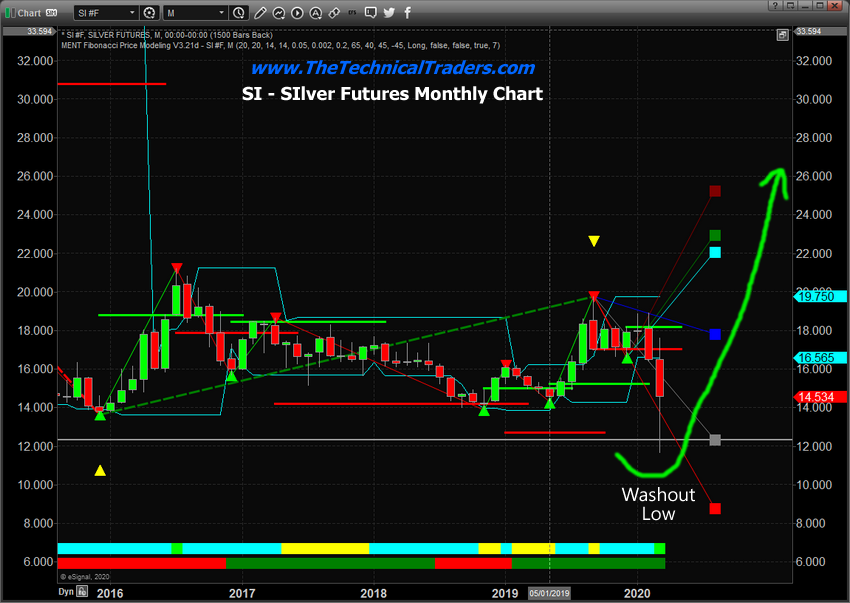
The extremely deep price retracement on this Monthly Silver chart (below) highlights what we believe is a deep washout low price rotation that is setting up the “disconnect” as we have tried to explain in the Gold/Silver ratio chart and historical Silver chart (above). Yes, Gold also moved dramatically lower over the past 2+ weeks illustrating the shock to the markets that took place as the Covid-19 virus event disrupted the US and global markets. But our researchers believe this dramatic washout low in Silver is setting up a much bigger pattern, longer-term than most people understand.
Recently, news that global precious metals suppliers have received a tremendous surge of orders for the physical stock over the past 2+ weeks (source: MSN). In fact, many global suppliers and mints are simply “out of stock” at the moment. This surge in demand changes the dynamics of the market and how we look at the washout low in Silver.
If demand continues to surge, which we have no reason to doubt at this stage of the Covid-19 virus event, and Silver begins to rally as it did in 2002~2005, then the Gold/Silver ratio will begin to collapse just as it did in 2003~2007 (see the first chart – Post “A”). This means the demand for metals is skyrocketing and Silver has suddenly become a more “in demand” physical metal than Gold.
Current Gold Weekly Chart
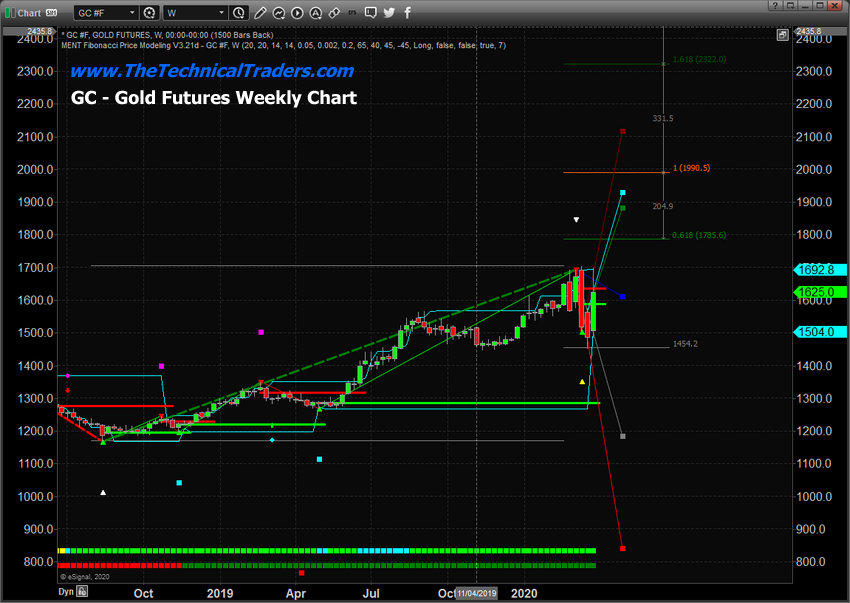
We believe the next phase of price action in Gold is a move above $1990 as demand for metals continues to surge. This would represent a 100% Fibonacci price expansion of the last price rally from the lows set in September 2018 (near $1168). It would also represent a rally from the current level of at least +22.50% in Gold. Subsequently, if Silver begins to rally at a greater rate than Gold over this same span of time, Silver could rally to levels above $22 representing a +53% price rally according to our Adaptive Fibonacci Price Modeling system (the CYAN target on the chart above).
Pay attention to the Gold/Silver ratio and the price of Silver compared to Gold over the next 30 to 60+ days. If our research is correct, the current low price of Silver will be a distant memory in less than 60 days and a tandem price advance in both Gold and Silver will propel the metals much higher. How much higher? From 2003 to the peak in 2011, Gold rallied 450% (from $350 to over $1900). Over that same span of time, Silver rallied 1024% (from $4.50 to just under $50).
If we are right about this pattern setup and the future opportunities it may present, we could see Silver trading above $160 per ounce within 4 to 7 years. Can you guess where Gold would likely be trading if Silver rallied 1000% from current levels? Don’t miss this next big move in the metals.
You don’t have to be smart to make money in the stock market, you just need to think differently. That means: we do not equate an “up” market with a “good” market and vi versa – all markets present opportunities to make money!
We believe you can always take what the market gives you, and make a CONSISTENT money.
Learn more by visiting The Technical Traders!
Chris Vermeulen
Technical Traders Ltd.
Disclosure: This article is the opinion of the contributor themselves. The above is a matter of opinion provided for general information purposes only and is not intended as investment advice. This contributor is not receiving compensation for their opinion.
Remain BEARISH against their recent highs. Neither metals, or the mining stocks have acted very well against the backdrop of an international crises, in itself a telling divergence against what the world was expecting of this sector's performance. This reminds me more of the metals behavior before, during, and likely after the 1987 market crash.
Considering recent movement (Last One to Three Months) of both, Gold and Silver,it can be observe that both metals caught in a side way move along with rapid but short spanned jumps and deeps. This can be presume an abnormal trade pattern, which is not found in routine trade. With a view to this, and also in the context of overall present and probable future situation of Economy world-wide, we must keep away from forecasting any Long Term or even Mid-Term trend probabilities.
I think, we may find some initial clues after or around next Bi-Monthly Gold Future Settlement, scheduled on 3rd April 2020, which is just 4 Days away. Meanwhile, we may found heavy or unpredictable volatility, in Gold Price, which is quoted now around $ 1615
The problem is if the paper price doesn't catch up with the hard price (bid/ask spread), you wouldn't be even close to selling near those asking prices you speak of. Just like we have now. Until everybody is forced to play on the same field under the same rules, the only people to make any real money are going to be the big guys. Your response would be greatly appreciated.