While the price of silver (SLV) has held up relatively well in June, considering the sharp declines in global markets, the Silver Miners Index (SIL) has not been as fortunate. In fact, despite silver being down just 7% year-to-date and being a sanctuary from the selling pressure, the Silver Miners Index has been battered, sliding 23% year-to-date and matching the decline of the S&P-500.
While the underperformance might be a head-scratcher for some, it shouldn’t be all that surprising, given that SIL is full of low-quality producers who have dragged down the ETF. However, with the proverbial babies being thrown out with the bathwater, we’ll look at three names approaching low-risk buy zones.
While the gold producers had a tough year in 2021 after lapping all-time highs for the gold price (Q3 2020), the silver producers had a solid year, benefiting from an attempted silver squeeze that kept silver prices elevated for much of 2021.
However, after a brief honeymoon period in 2021, we’re now seeing the hangover. This is because silver producers must lap an average silver price of ~$26.00/oz from last year while contending with higher fuel, labor, and materials costs. Not surprisingly, this has put a severe dent in margins, exacerbated by silver spending most of Q2 below $23.00/oz.
Fortunately, while this has made most names un-investable as they lap insurmountable comps, three names stand out:
Wheaton Precious Metals (WPM - Get Trend Analysis Report)
SilverCrest Metals (SILV - Get Trend Analysis Report)
Hecla Mining (HL - Get Trend Analysis Report)
Wheaton Precious Metals (WPM)
Beginning with Wheaton Precious Metals, the company was raised to handle inflationary periods like we’ve found ourselves in, with a royalty/streaming business model that leaves it insulated from rising operating costs and increased capital expenditures. This is because the company provides upfront payments to producers and developers to help them finance the construction/expansion of their projects, receiving a portion of revenue from the mine in return.
The result is that WPM pays a fixed amount for a portion of metal produced from the mine (15% - 25% of the spot price), allowing it to maintain exceptional margins even when producers’ margins are pinched.
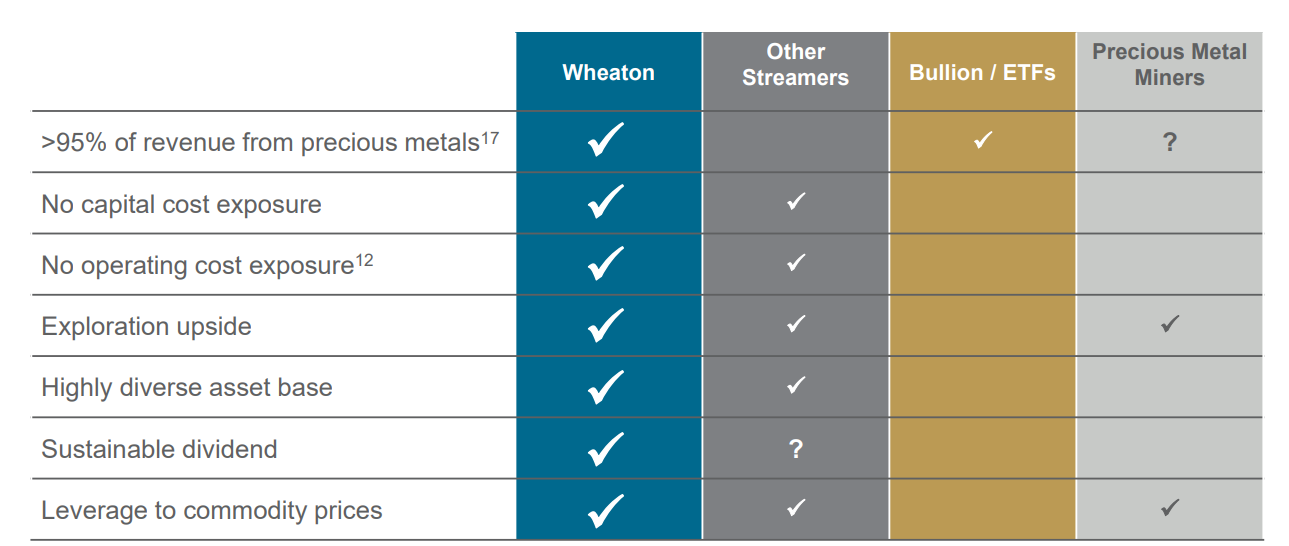
Source: WPM Business Model, Company Presentation
Given this superior business model, Wheaton has historically traded at a premium valuation, with a 5-year average earnings multiple of 37.7. Given the inflationary environment that favors exposure to royalty/streaming companies, and the fact that Wheaton has upgraded its 5-year growth outlook with the addition of several streams recently, I believe a more appropriate earnings multiple is 39.
If we multiply this figure with FY2023 annual EPS estimates of $1.46, this translates to a fair value for the stock of $56.95, translating to a 46% upside from current levels. Based on this, Wheaton is currently on a Buy rating, and I see this pullback below $39.00 as a gift.
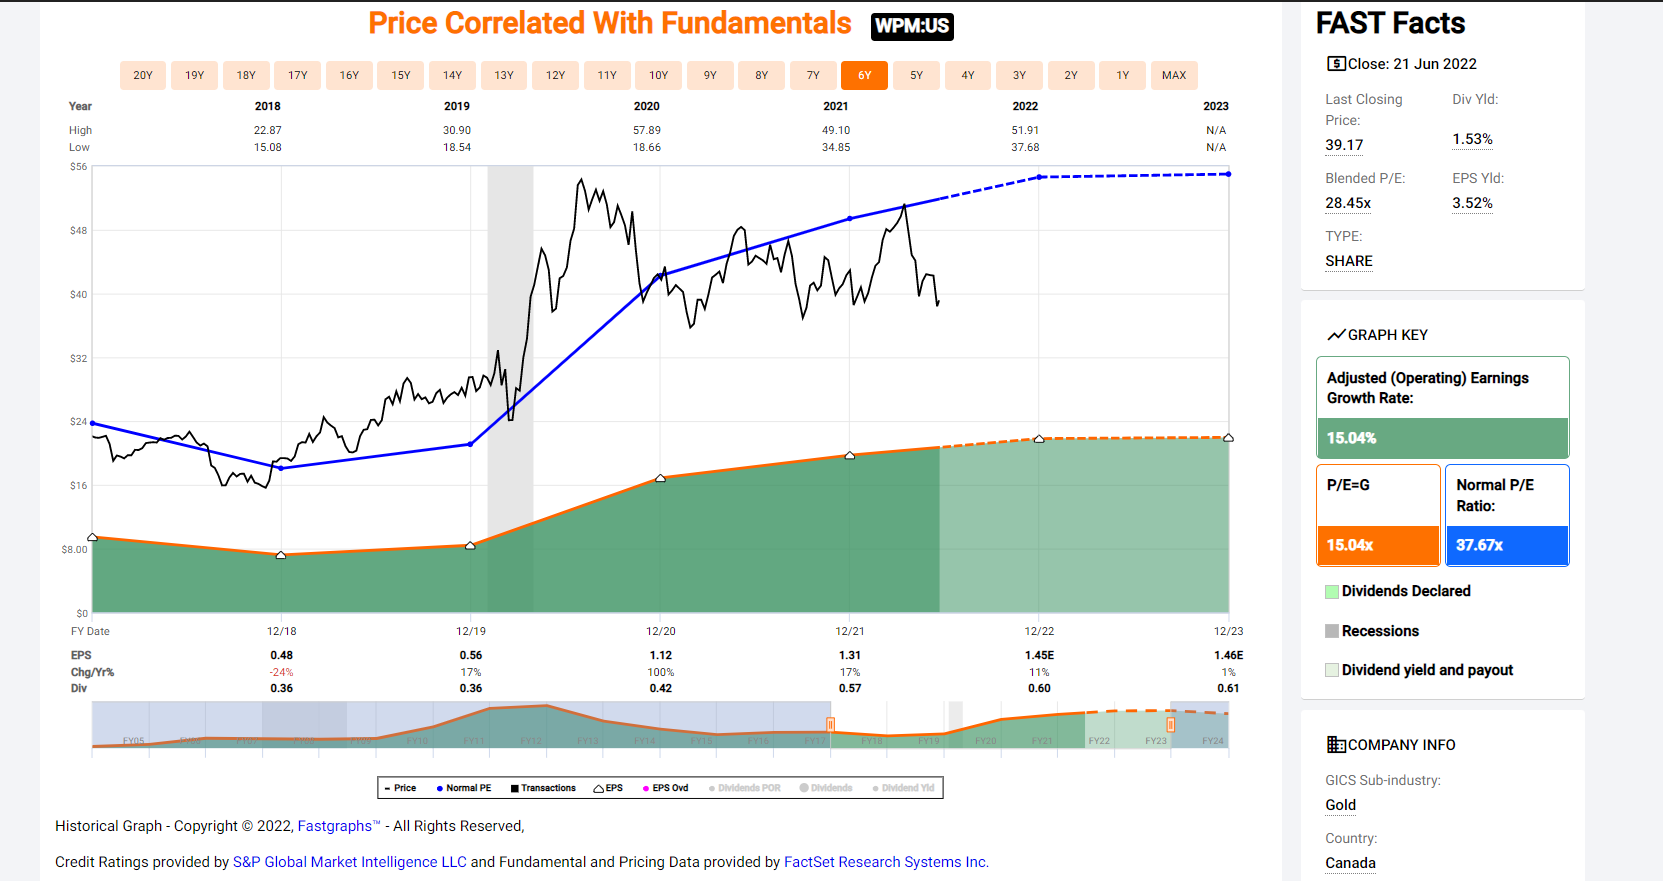
Source: FASTGraphs.com
SilverCrest Metals (SILV)
The second name worth keeping a close eye on is SilverCrest Metals (SILV), the newest company to join the producer ranks after commissioning its Las Chispas Project in Mexico last month.
While the mine may be relatively small, with a planned throughput rate of just 1,250 tonnes per day, it certainly packs a punch. This is because it has an estimated head grade of 900 grams per tonne silver-equivalent, a figure that is quadruple the average mined grade sector-wide.
This is expected to translate to an average annual production profile of 12.4MM silver-equivalent ounces per annum over the first seven years (2023-2029) at industry-leading all-in sustaining costs below $7.50/oz.
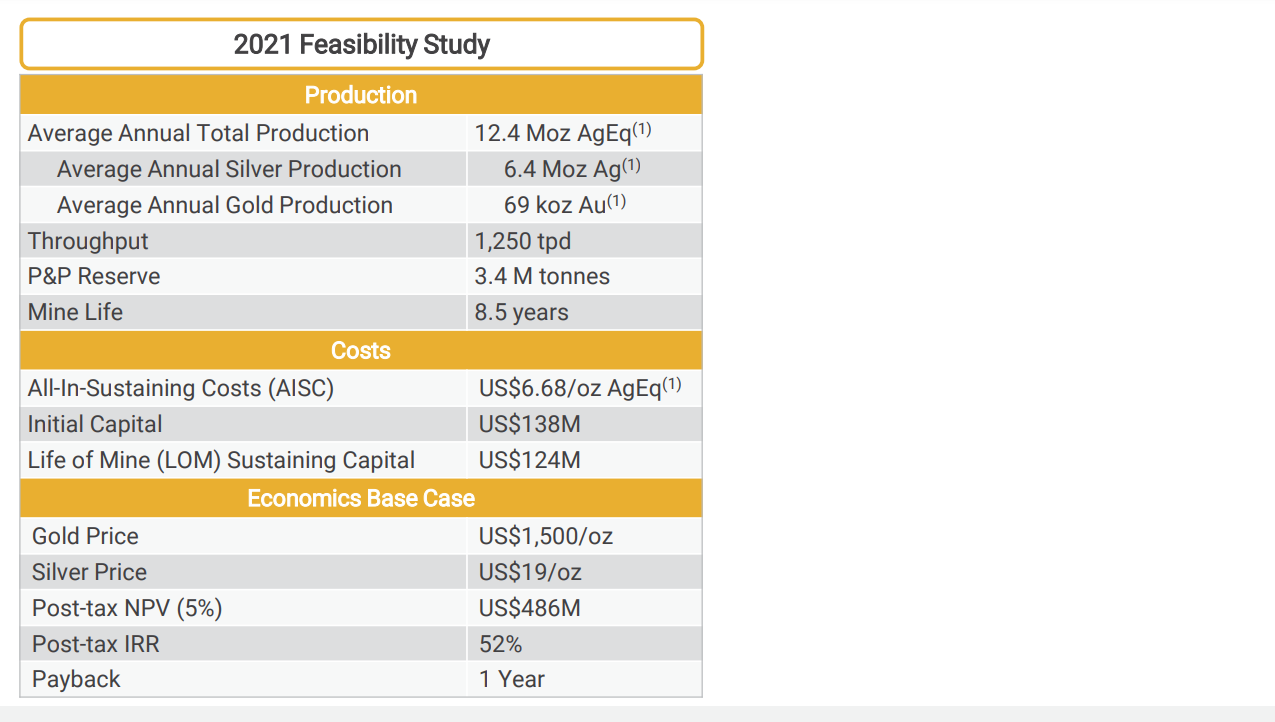
Source: Las Chispas Feasibility Study, Company Presentation
Given that SilverCrest is a producer, it is not insulated from inflationary pressures like WPM, meaning that it will see pressure on wages, fuel, and materials costs when it comes to sustaining capital.
However, given that its grades are nearly 4x that of its peers, the company has significantly less labor and uses a fraction of the fuel of its peers, given that it’s a high-grade underground operation. For this reason, it should see less cost creep, and it already has 65% ($22.00/oz silver price), which assumes a 10% cost escalation vs. its most recent study.
So, with SILV being one of the only producers in the silver space relatively insulated from costs combined with industry-leading margins, I see the stock as one of the most attractive buy-the-dip candidates for investors looking for silver exposure.
Hecla Mining (HL)
The final name on the list is Hecla Mining (HL), a multi-asset producer with silver mines in Idaho and Alaska and a gold mine in Quebec, Canada. Like SilverCrest, Hecla ranks very high on grades, with an average silver grade north of 400 grams per tonne and a silver-equivalent grade above 600 grams per tonne.
It also operates two very high-grade underground silver mines and benefits from by-product credits (lead, zinc), allowing it to keep its costs below $10.00/oz. If we compare this to the industry average cost profile of $15.00/oz, this places Hecla in a great position to absorb any cost increases, given that even at a $16.00/oz silver price, its mines would be highly profitable.
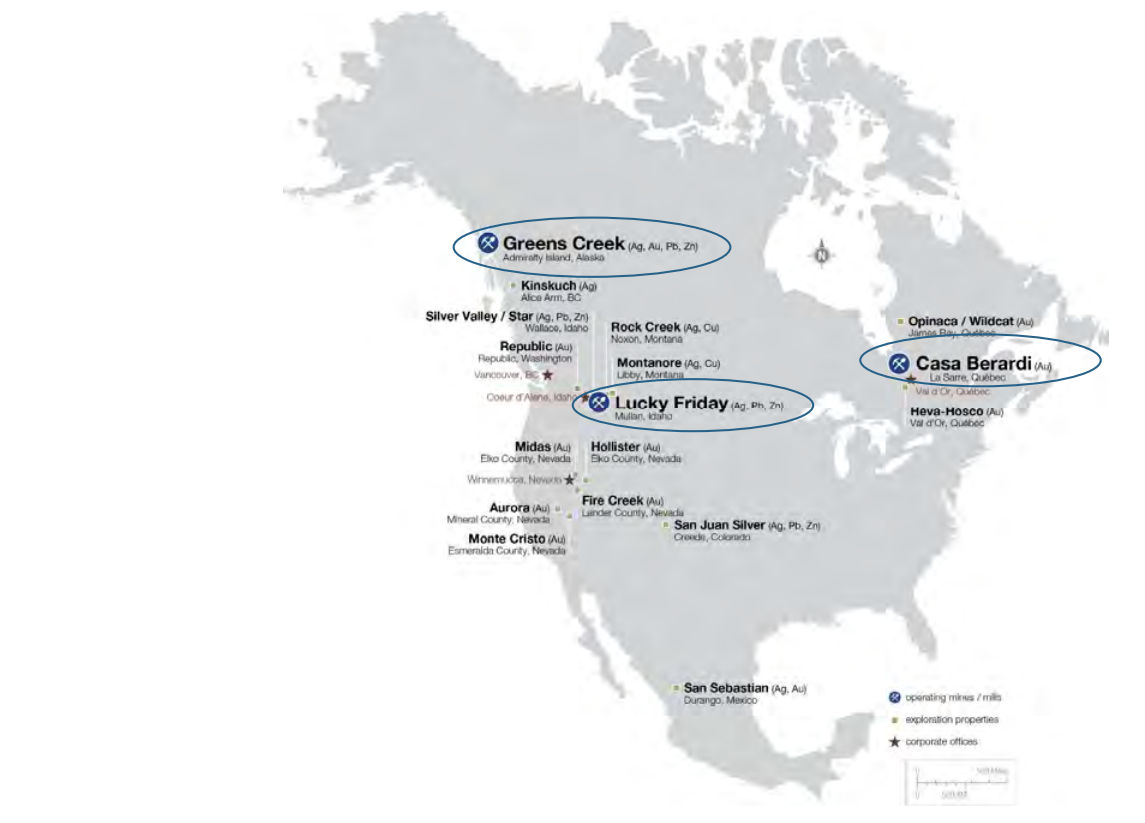
Source: Hecla Operations, Company Presentation
Given the benefit of higher zinc prices and its high-grade, relatively low-volume operations, Hecla has skated past most of the inflation experienced sector-wide, except for labor. This means it’s seen much less margin contraction than peers, even with a declining silver price.
Just as importantly, Hecla is one of the only producers with all its operations in Tier-1 jurisdictions, which typically commands a premium multiple. Conversely, most silver producers are based in Peru, Mexico, and Chile, some of the top silver-producing nations.
Hence, not only is Hecla relatively insulated from an inflationary standpoint, but it’s insulated from a risk standpoint, with a low risk of excessive taxes, unfavorable royalties, and or nationalization in the United States/Canada.
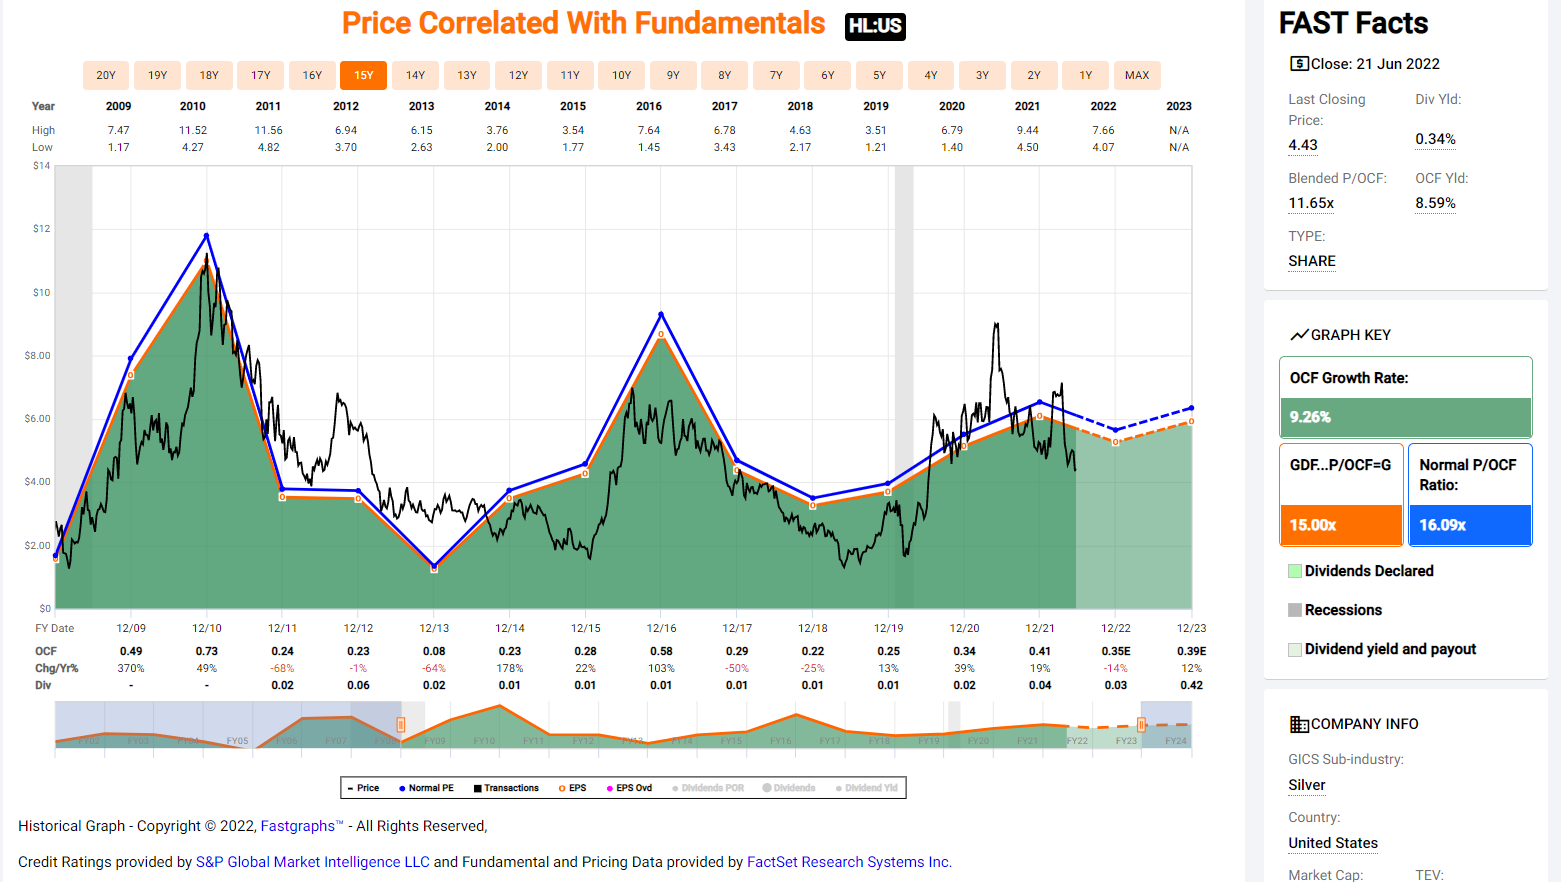
Source: FASTGraphs.com
Given Hecla’s Tier-1 jurisdictional profile, long reserve life at its assets, and strong margins, the company has historically traded at 16x cash flow, a premium to its peer group. Based on what I believe to be a more conservative multiple of 14.0x cash flow and FY2023 cash flow estimates of $0.40, I see a fair value for the stock of $5.40.
This translates to a 25% upside from current levels ($4.30), and any pullbacks below $4.05 (25% discount to fair value) would present low-risk buying opportunities. So, while I am not long the stock yet, I would view further weakness as a buying opportunity.
Final Thoughts
While the silver miners are out of favor due to declining margins, they will be lapping their toughest comps next month (Q2 2021) and will have much easier comps ahead. This should take the weight off the index and allow for a recovery in the Silver Miners Index by year-end.
Combined with attractive valuations, I see HL, SILV, and WPM as three of the better ways to play a rebound in the silver price.
Disclosure: I am long WPM
Taylor Dart
INO.com Contributor
Disclaimer: This article is the opinion of the contributor themselves. Taylor Dart is not a Registered Investment Advisor or Financial Planner. This writing is for informational purposes only. It does not constitute an offer to sell, a solicitation to buy, or a recommendation regarding any securities transaction. The information contained in this writing should not be construed as financial or investment advice on any subject matter. Taylor Dart expressly disclaims all liability in respect to actions taken based on any or all of the information in this writing. Given the volatility in the precious metals sector, position sizing is critical, so when buying small-cap precious metals stocks, position sizes should be limited to 5% or less of one's portfolio.
