
The title of this post is not clickbait; please keep reading until the end to see why silver can hit these levels.
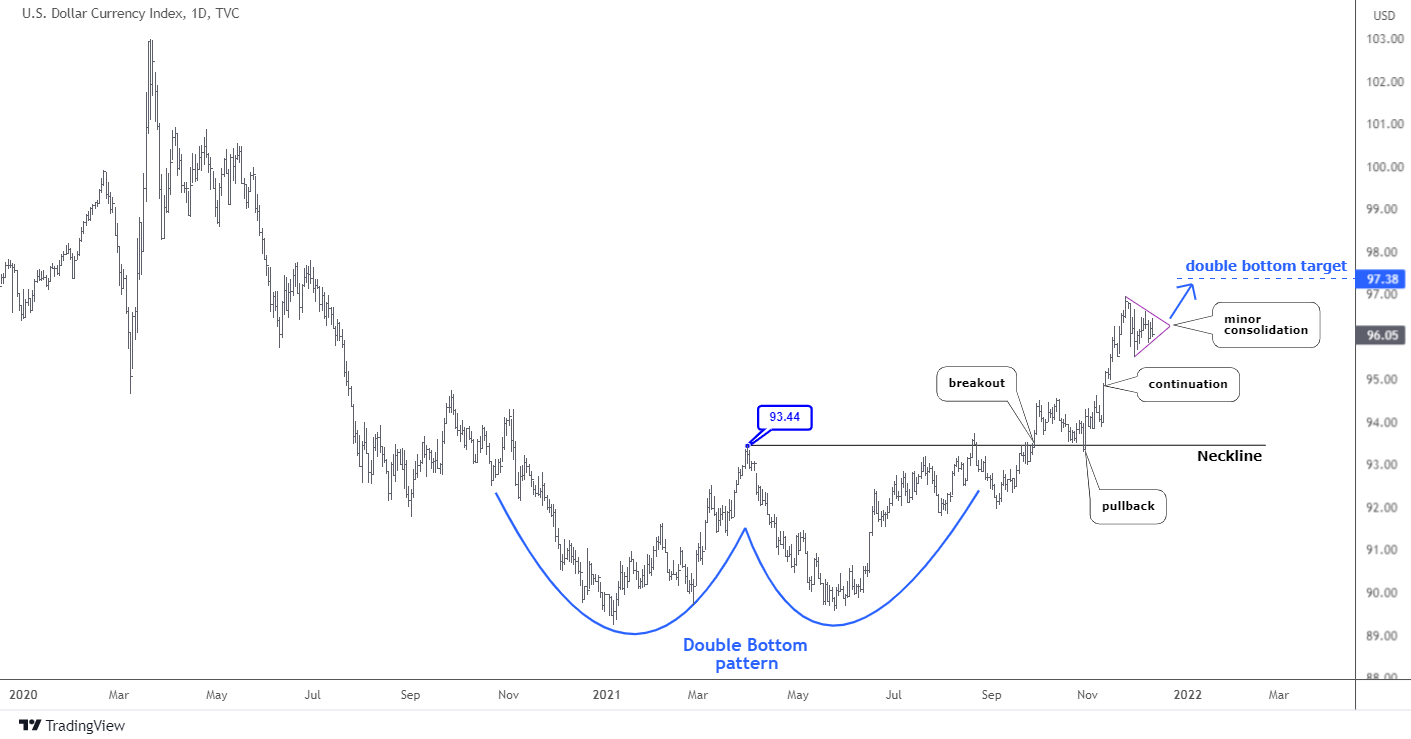
The bullish pattern is shown in the dollar index chart in my December post with a question in the title "Is The Dollar Going To Steal The Santa Claus Rally?" played out as planned to destroy the rally of top metals.
Let us see the updated silver chart below.
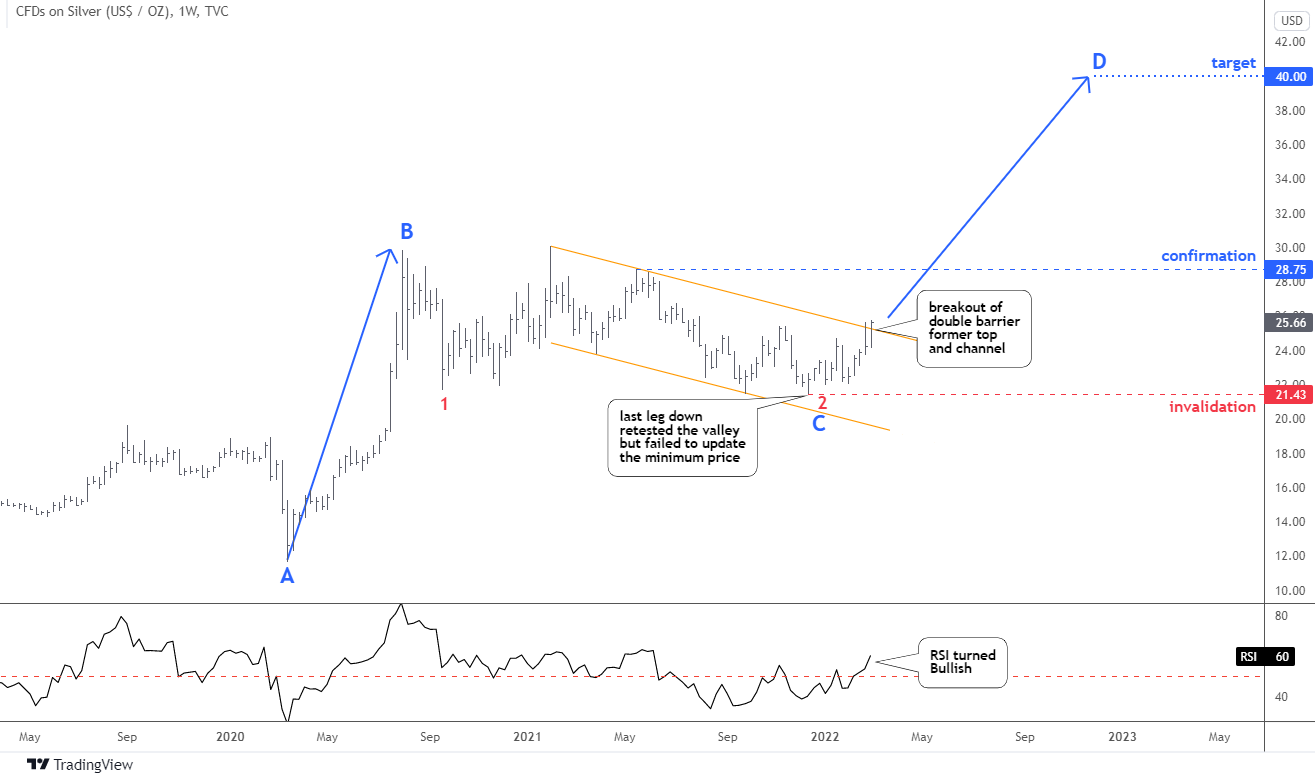
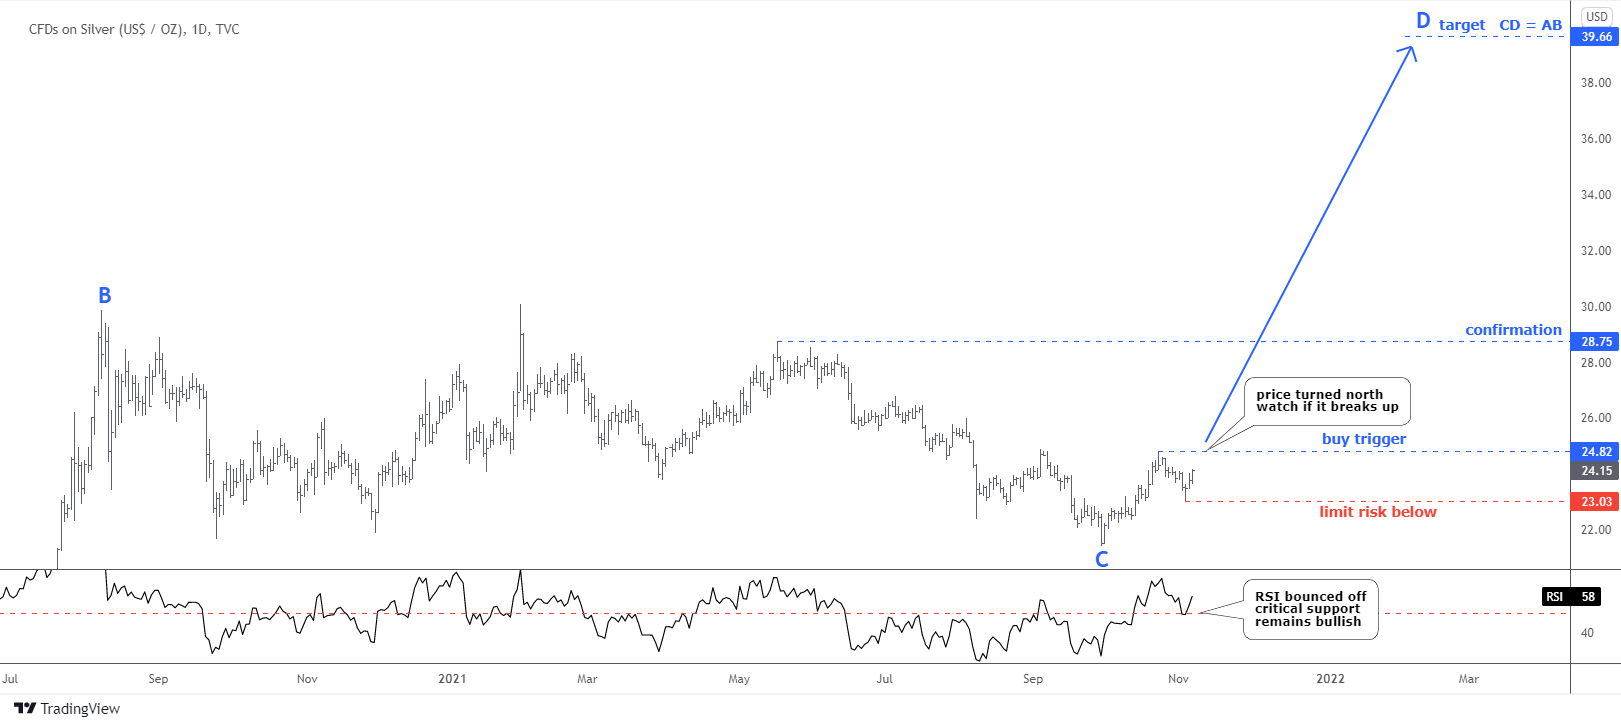
The previous bullish setup for silver has been annihilated by the ongoing strength of the dollar. The price has dropped in another leg down to retest the former valley of $21.43. It has failed to update the minimum price as it stopped right there, and then the price bounced to the upside.
Although the second red leg down did not drill too much below the valley of red leg 1 ($21.67), it took so much time to emerge, almost two months in leg 1 versus more than ten months in leg 2. The latter extended itself repeatedly until we saw the reversal to the upside last December. The red leg 2 organically fitted in the orange downtrend channel with two touch points on both sides.
Last week silver finally broke up and closed above a double barrier: the orange channel and the last November top. A final confirmation is still there at the peak established last May at $28.75.
The target remains unchanged, as no new valley has been established since last November. It is located at $40, where the blue CD segment equals the AB segment with a little roundup.
The invalidation level is located in the valley of red leg 2 at $21.43.
It is time to elaborate on the second target of $81 for silver. Indeed, it is a long-term goal based on the high-resolution chart. It might be time to dust off the chart based on the insight of one of our observant readers suggested back in December 2016.
Here we go, a yearly chart of silver futures.
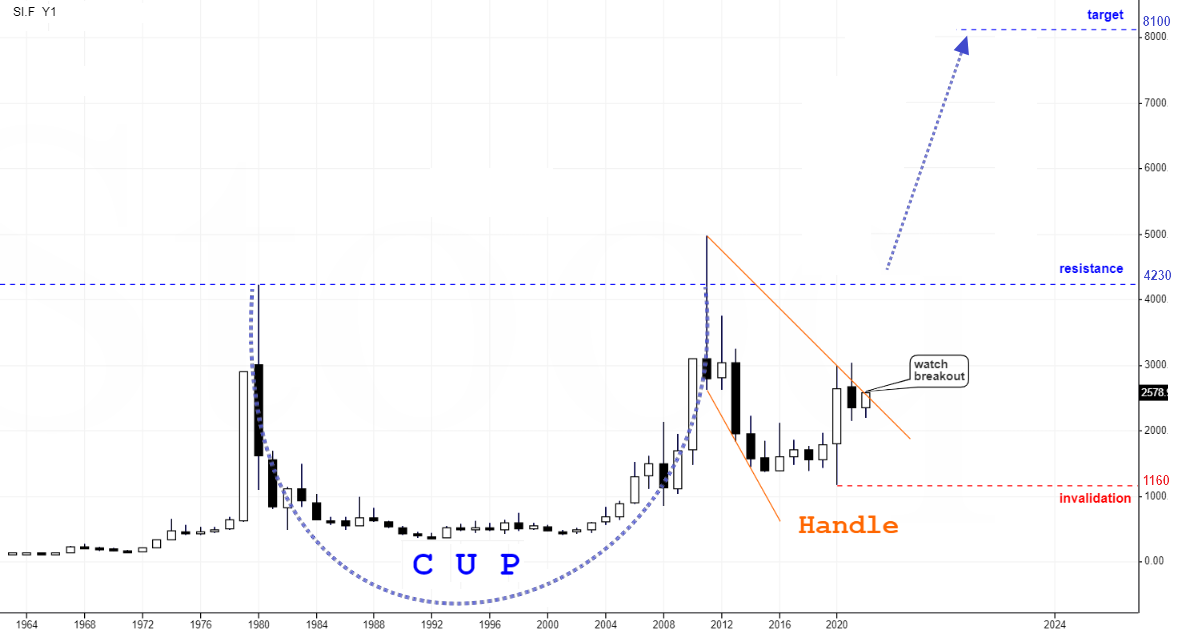
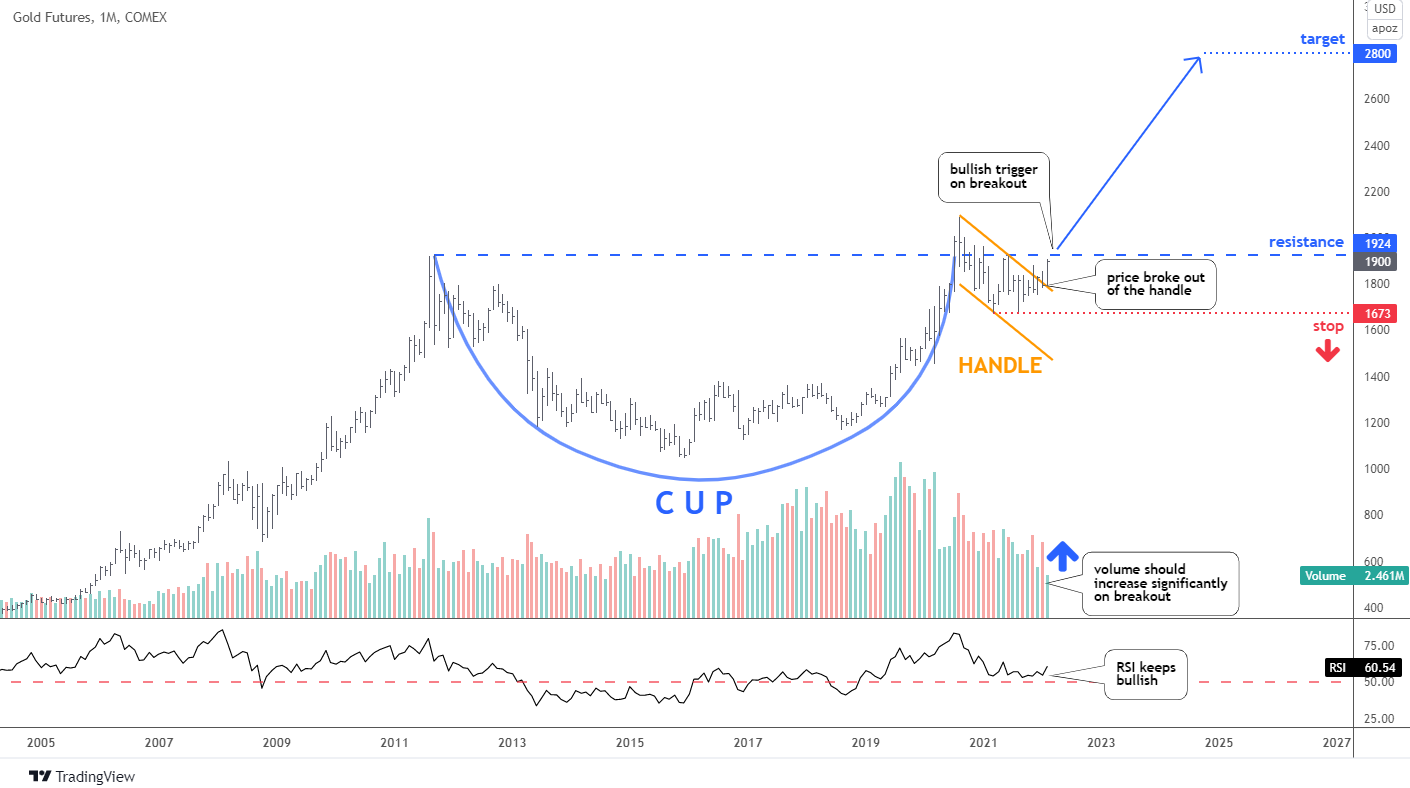
Recently, we have seen this pattern in the gold chart although on a smaller time frame. It is active already on the breakup of resistance that occurred last month.
We have a Mega Cup & Handle pattern in the yearly silver futures chart above. The huge Cup is blue, and the large Handle is within orange trendlines. The progress is slow as each candle takes a year to build. The Cup had been shaped within thirty-one years. The Handle takes eleven years already as it has a normal proportion visually.
The price of silver futures is right at the barrier of the upper orange trendline of the Handle now. The visible breakup would give hope for further continuation to the upside. We have a bullish alert in the first weekly chart above already.
The crucial part of the pattern is located at the left top of the Cup at $42.3. I marked it as a resistance (blue). It matches with the target area in the first weekly chart above. It is an amazing confluence of different approaches. The breakup of the resistance would activate the pattern.
The target is located at a depth of the Cup added to the breakout point. It is highlighted in blue at $81, which means more than a threefold increase of the current price.
The invalidation point is located in the valley of 2020 below $11.6.
Intelligent trades!
Aibek Burabayev
INO.com Contributor, Metals
Disclosure: This contributor has no positions in any stocks mentioned in this article. This article is the opinion of the contributor themselves. The above is a matter of opinion provided for general information purposes only and is not intended as investment advice. This contributor is not receiving compensation (other than from INO.com) for their opinion.
I think that the “handle” goes down too deep to be considered a legitimate handle formation.
Dear Ed,
I really appreciate your regular comments.
Indeed, the pattern does not look as neat as that one we could observe in the gold monthly chart https://assets.ino.com/img/sites/ino/email/13133.jpg
Let us give it a chance as the time frame is big, the range is huge and the bounce in the 2020 candle is promising.
Good luck, Aibek
silver pivot chart shows 53.22 near term
https://invst.ly/xmgyw
Dear Silver Surfer,
Thank you for sharing.
I see your target corresponds to 4.236 Fibonacci extension.
Let us live and see.
Best wishes, Aibek