
It turned out that the dollar weakness we observed in February was about to be over right after the earlier update. I thought we would see more downside for the DX in the area between 94.4 and 92.5 (Fibonacci retracement levels) before the rally resumes, and most readers supported that idea. However, the rally started immediately.
The inflationary pressure underpins the dollar, as the Fed has turned strongly hawkish on the interest rate and tapering. Let us check out the updated daily chart below.
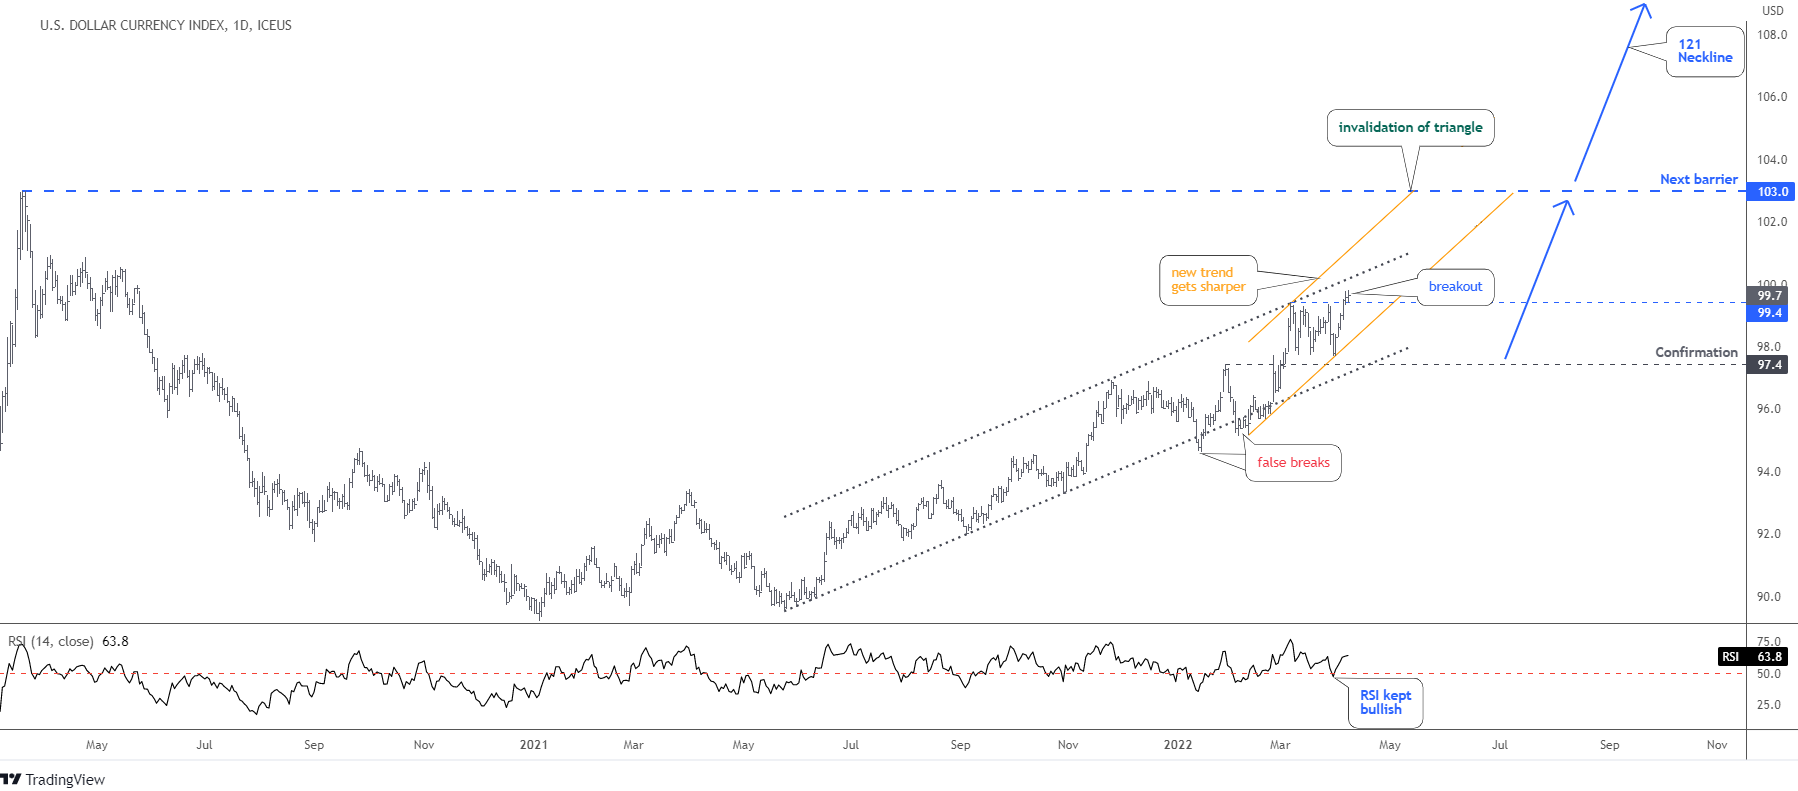
In my previous post, we saw the DX piercing down the dotted gray uptrend. Those punctures turned out to be false breaks, as fallouts of the channel were temporary, and the move up resumed overcoming above the preset confirmation level of 97.4.
At the beginning of March, the trend channel's resistance stopped that rally at 99.4, proving its validity. The dollar index has been trapped between trendline resistance and the former peak of 97.4, shaping the sideways consolidation in the form of a perfect rectangle.
The RSI kept above the crucial support of 50 during the entire consolidation preparing the ground for the current strength.
This week, the price broke above the top of consolidation beyond 99.4. This opens the way to the next target of 103 (Y2020 top). I built the new orange uptrend as the price has built new touchpoints. It is sharper than the current channel, pointing right at the next target area.
We could see the invalidation of a triangular scenario soon if the price would hit the next target. Only the simple one-way-up path (blue) would stay and play then.
The massive barrier stands at 121 at the Neckline of the Giant Double Bottom pattern and the Fed should show more "trump-cards" to let the dollar overcome that huge resistance.
Last June, I called on the
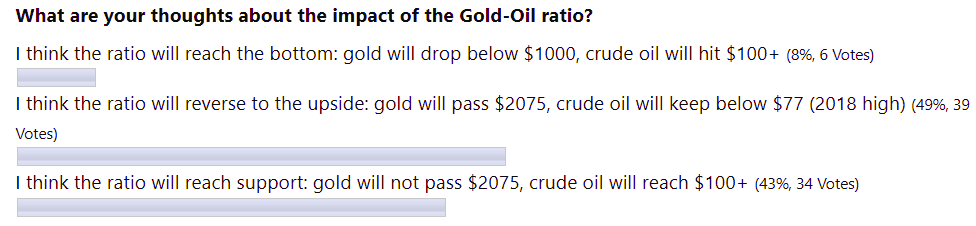
The majority of readers picked the stronger gold and the oil price below $77 at that time. It was a natural choice, as nobody wants the high cost of the energy that we suffer these days. The winning bid was the second one: gold will not surpass $2075 (it didn't), and crude oil will reach $100+ (it really did).
Those targets were based on the assumption of the collapse of the ratio down to the long-term support of 18 oil barrels per troy ounce of gold. Then, the ratio stood at 26 barrels. Last month the ratio dipped to a low of 16 barrels as crude oil futures reached $130, the level unseen for more than thirteen years.
I think we will see higher oil prices again. Let me show it in the weekly crude oil futures chart below.
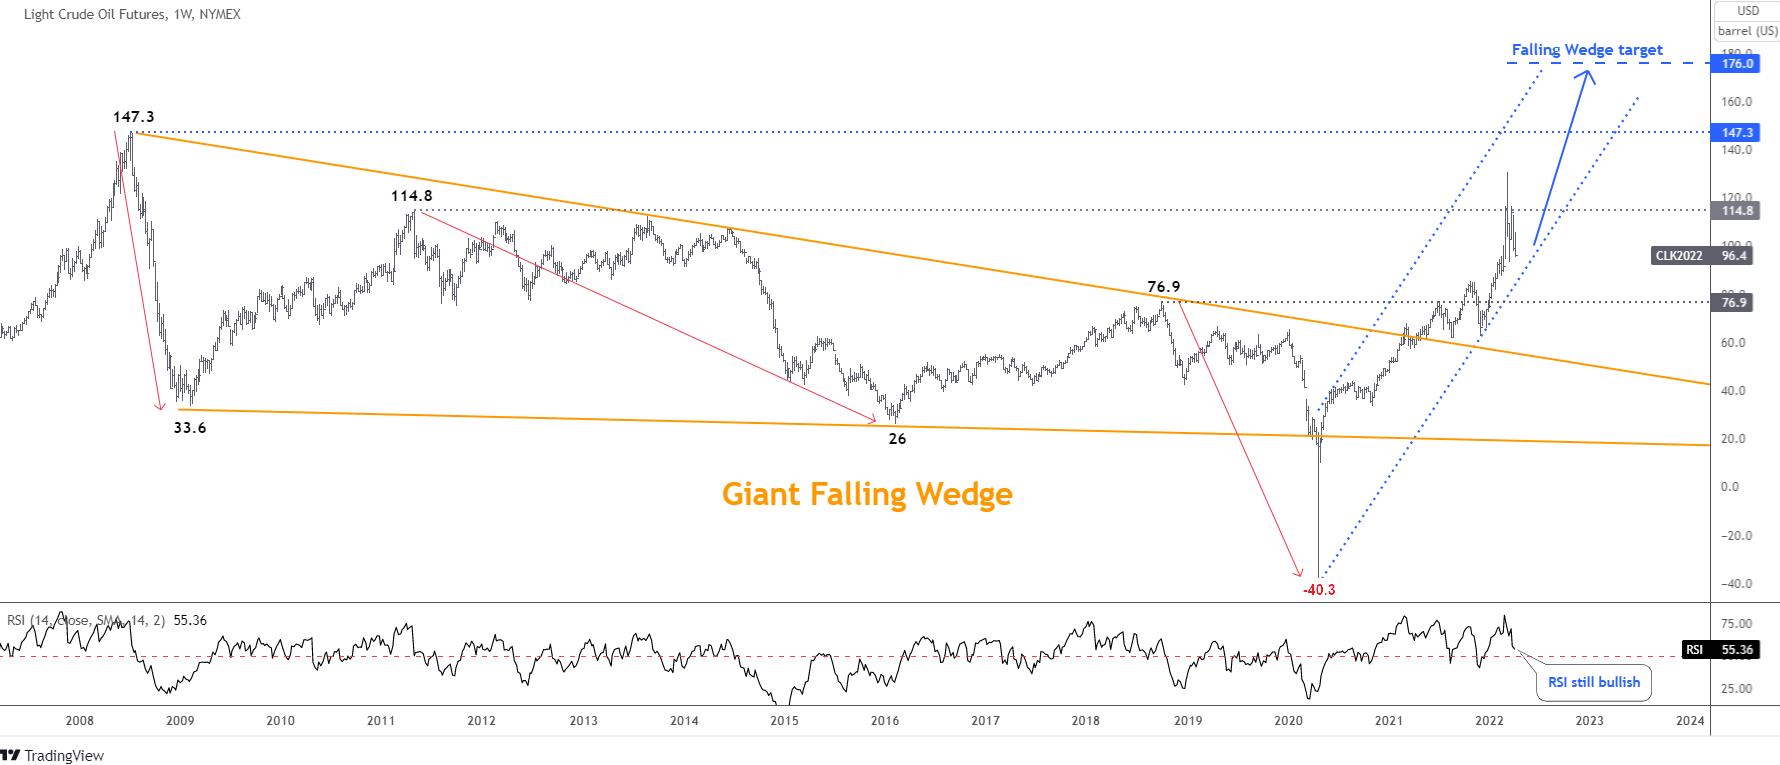
This map above has been shown in 2019 in the post “Are You Waiting Crude Oil At $20?”. Indeed, the price collapsed from $59 in 2019 down to $20 target and even worse into the negative numbers in 2020.
The Giant Falling Wedge pattern has been shaped in the chart. After two years, the severe drop below the downside of the pattern looks like a false break as the price rapidly recovered to get back above the pierced support. The pattern is bullish; the price has been acting like in a textbook. We could spot the breakout and the following throwback to the broken resistance. Then the strong rally kicked off to break all the barriers preceding the all-time high at $147.3.
There is a blue sharp uptrend channel in the chart. The current price collapse could land on the downside of the channel around $85. However, the RSI is still bullish, and it has room for the price to test the mentioned support.
The Falling Wedge target is located at $176, which is way above the all-time high. It was computed by adding the widest part of the pattern to the breakout point of the Wedge. This ambitious price target is still within the hypothetical scenario of the Gold-Oil ratio in case it will drop to the next support of 7 oil barrels per gold troy ounce.
Please share your thoughts on both instruments in the comments below to broaden our view.
Intelligent trades!
Aibek Burabayev
INO.com Contributor, Metals
Disclosure: This contributor has no positions in any stocks mentioned in this article. This article is the opinion of the contributor themselves. The above is a matter of opinion provided for general information purposes only and is not intended as investment advice. This contributor is not receiving compensation (other than from INO.com) for their opinion.
Hi
Hello Mr.Mahakur, welcome back to the Blog.
The inflation adjusted price of oil’s 2008 $147 peak is how much? $190?
Anything below $190 is just a weaker bounce.
Dear Ryan,
Kudos to you for adding another supporting factor for the oil price.
Your real price estimate almost coincides with Reuters calculations half year ago:
https://www.reuters.com/business/energy/how-high-are-oil-prices-really-kemp-2021-10-05/#:~:text=If%20record%20Brent%20prices%20in%202008%20are%20restated%20at%20the%20purchasing%20power%20of%20the%20dollar%20in%202021%2C%20prices%20peaked%20at%20more%20than%20%24180%20per%20barrel.
Thanks for heads up, best wishes!
Aibek
China is in lockdown and that is the biggest negative.
Gasoline is over pre-pandemic levels and it is the shoulder season. - Ditto fuel oil. Diesel is in shortage, and jet fuel is the laggard but has now reached pre=pandemic consumption, and international travel still is opening up.
Fossil fuel consumption is ALWAYS underestima.ted by emerging market demand!
Even if 1 million barrels of Russia's production get constrained, there will be a continuing storage drain and prices will firm up. Add inflation to 2014's 147 a barrel and you'll be teasing $200 crude with $190.00 .
Be there by July is my swag!
Bob
Dear Mr.Furman,
Thank you for sharing your valuable thoughts.
I can only add the quote from OPEC about huge loss of Russian oil:
"We could potentially see the loss of more than 7 million barrels per day (bpd) of Russian oil and other liquids exports, resulting from current and future sanctions or other voluntary actions," OPEC Secretary General Mohammad Barkindo said, according to a copy of his speech seen by Reuters.
https://www.reuters.com/business/energy/eu-meets-opec-amid-calls-oil-output-increase-2022-04-11/
See you in July, cheers! ))
Aibek
Oil I think will not go above 150 because consumers will not be able to survive at that price and no matter what charts tell us , you have to have real buyers of the real commodity. I wouldn't think it would go above the 130 if this administration was not so anti oil, anti fossil fuels. Unfortunately they refuse to look at all facts, this stupidity is heading us down a rapid pace to becoming a third world country.
Dear Mr.Rabenhorst,
Thank you for sharing your time to voice your valuable thoughts.
The world is facing large challenges from different areas these days,
the oil price is the clear indicator of that.
We do not see any ease in this massive pressure.
Consumers already started to suffer when price overcame $80.
Let’s live and see.
Best wishes, Aibek