
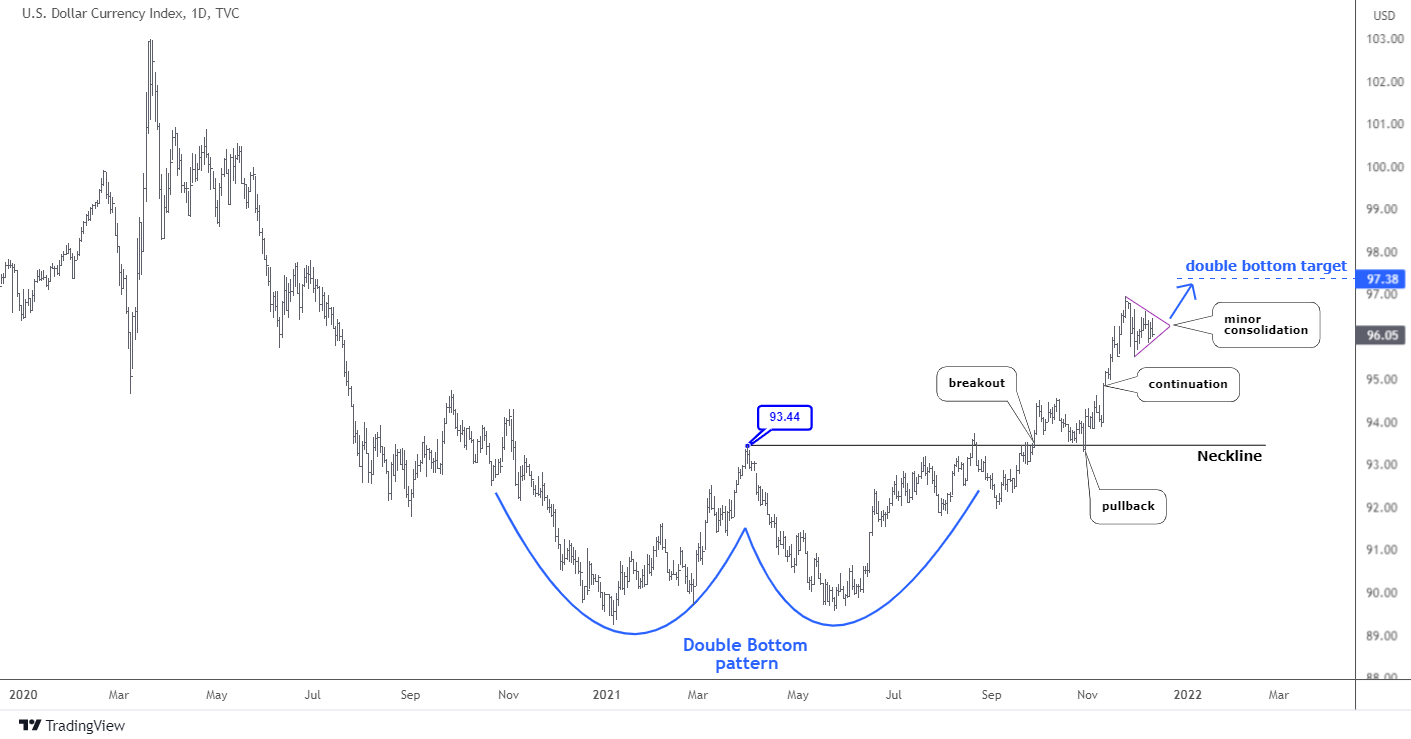
Last December, in the post titled "Is The Dollar Going To Steal The Santa Claus Rally?" I had shown you how a well-known “Double Bottom pattern” had been emerging in the daily chart. According to your voting, most of you have spotted that model as well.
I put the updated chart below to show you the path of the price on its way to the target.
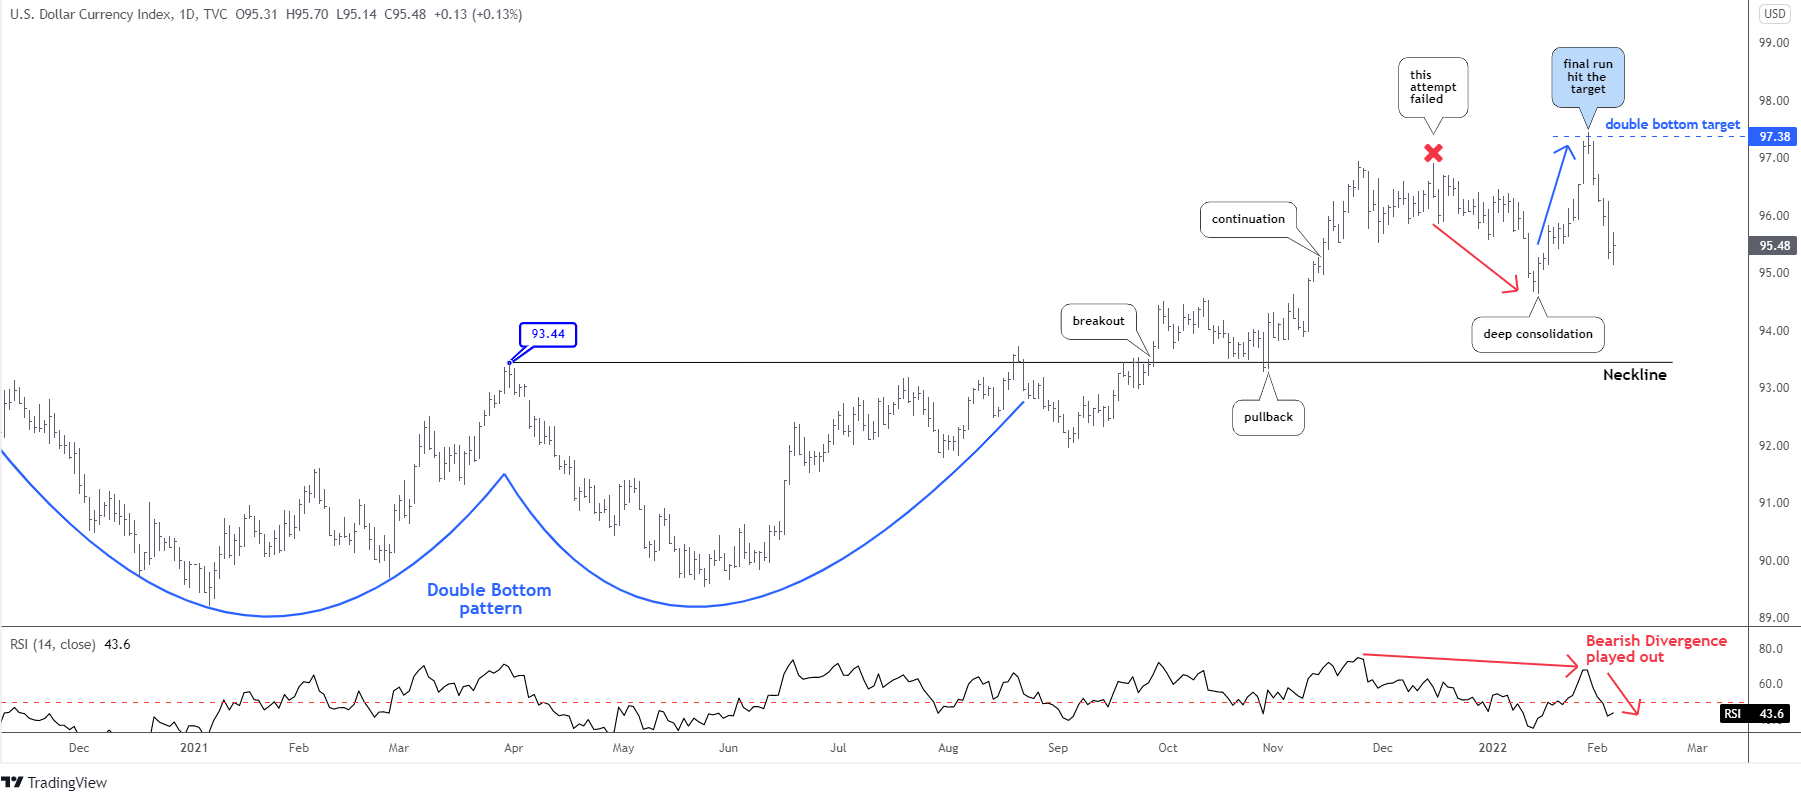
The dollar index (DX) has tried to climb over the previous top right after the post. This promising attempt has failed (red X), turning into the deeper complex consolidation (red down arrow). The good thing from a technical point of view was that the price has remained above the Neckline, although the depth of correction was scary.
The hawkish Fed supported the reversal and the further final run to the upside to hit the target of the pattern at $97.38. It is amazing how the price accurately broke into the aimed area at $97.44 and then collapsed right after.
The RSI has not confirmed the new higher top showing the Bearish Divergence. However, this distortion has played out instantly as the price has collapsed almost in the area of earlier deep consolidation.
What is the next? Your medium-term and long-term outlooks were mixed as you have chosen a Bearish path for former and Conservatively Bullish for a longer distance.
Let me share with you my outlook in the next chart below.
The dollar index saw profit-taking selling pressure last week on the news that the European Central bank (euro, the largest component of DX) could lift its policy rate earlier than stated before, possibly in the last quarter this year. Moreover, the Bank of England (GBP, the third largest part of DX) last week raised the base rate by 25 basis points to 0.5%.
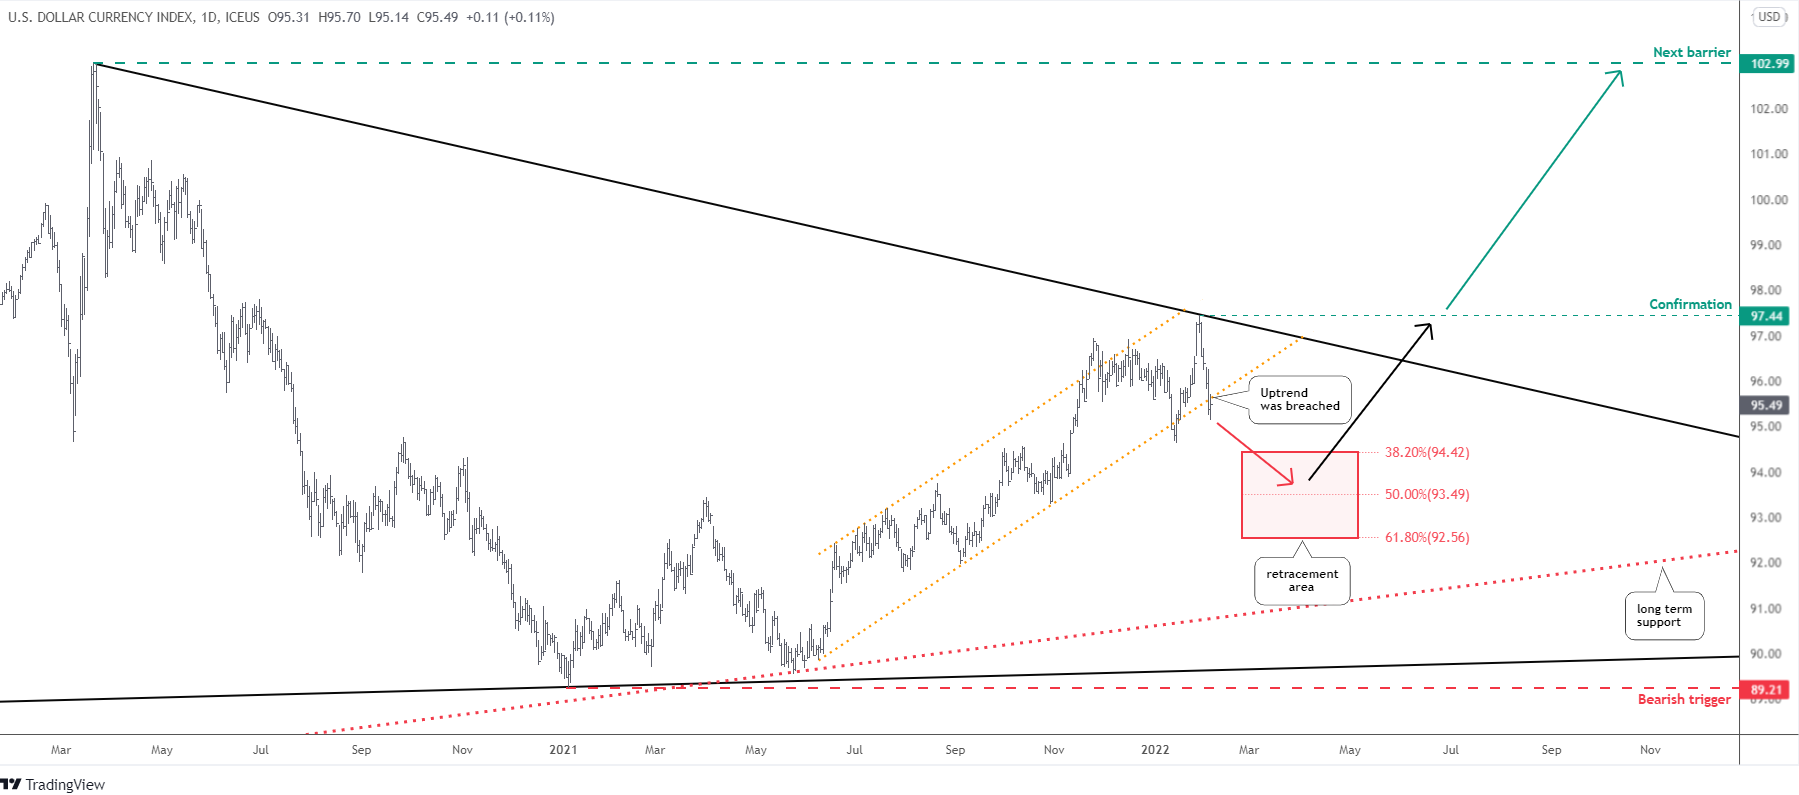
The dollar index (DX) has breached the orange uptrend. I added the Fibonacci retracement area (red) between $94.42 (38.2%) and $92.56 (61.8%) to watch the depth of the current correction.
Buy rumors sell facts; the news mentioned above will pressure the dollar index for a short period. Nevertheless, let us not forget that some analysts think of more hikes from the Fed (up to five), which could lift the comparative attractiveness of dollar-denominated assets in the medium term.
In this regard, I take the scenario of triangular consolidation as primary. It was shown initially in distant September of 2020. I assume that after retracement, we will see a renewed demand for the dollar. This should push the price beyond the triangle's resistance (black). The former top of $97.44 would be a critical point of the pattern's breakout confirmation. There are no other barriers on its way to the upside until we hit the $103 handle.
Those readers who keep the bearish stance on the dollar index (DX) should watch the breakdown of the long-term trendline support (red dashed) below $90.7 as the first alert. The final confirmation comes with the collapse of the price below $89.21; the valley was established last January.
Intelligent trades!
Aibek Burabayev
INO.com Contributor, Metals
Disclosure: This contributor has no positions in any stocks mentioned in this article. This article is the opinion of the contributor themselves. The above is a matter of opinion provided for general information purposes only and is not intended as investment advice. This contributor is not receiving compensation (other than from INO.com) for their opinion.
These prices are the dollar vs other fiat currencies. I believe this is almost meaningless. All fiats are going to collapse. It will not matter much which is the "strongest". Is there a dollar value index against a basket of commodities, not other fiats? I also just read that inflation is the percent expectation for the loss of value of the dollar, which should about match a rise in the value of gold. Would you lend out money if you did not expect to get the same value back at the end of a period of time?
Dear Mr. Nepveux,
1. I see your logic about fiat vs fiat. You feel yourself like a person who sees two neighbors arguing whose house is bigger when tornado is coming. You might have seen the comparison chart of all dominating currencies in the past and according to historically based estimates the dominance of dollar could last another 30-50 years. A friend of mine usually says that our biological life is too short to see real changes.
2. Indeed, there is an index tracking value of commodities against the dollar - The Refinitiv/CoreCommodity CRB Index (CRB index). I wrote about its bullish prospects last November at this link https://www.ino.com/blog/2021/11/commodity-prices-hit-7-year-high-amid-new-bull-run/
3. I could share your concern about the value of money. The recent finding fortifies that feeling as one of food operators increased sales for almost 20% with increase of physical volume of sales only for 0.3%. The simple math shows the robust price growth is the only factor.
Thank you for reading and sharing your thoughts.
Take care, Aibek
Hi
Dear Mr.Mahakur,
Thank you for stopping by and say hi!
Have a great day, cheers.
Aibek