
The inflation rate rose 0.2% in April; is the glass half empty or half full?
Today the BEA (Bureau of Economic Analysis) released the PCE (personal consumption expenditures) for April 2022. This report is the preferred inflation gauge used by the Federal Reserve as a key component to shape their forward guidance of monetary policy.
A Glass Half Full
In the case of today's report, the data indicates both positive changes in the rate that inflation is rising and also indicates that inflation continues to run extremely hot and remain extremely persistent.
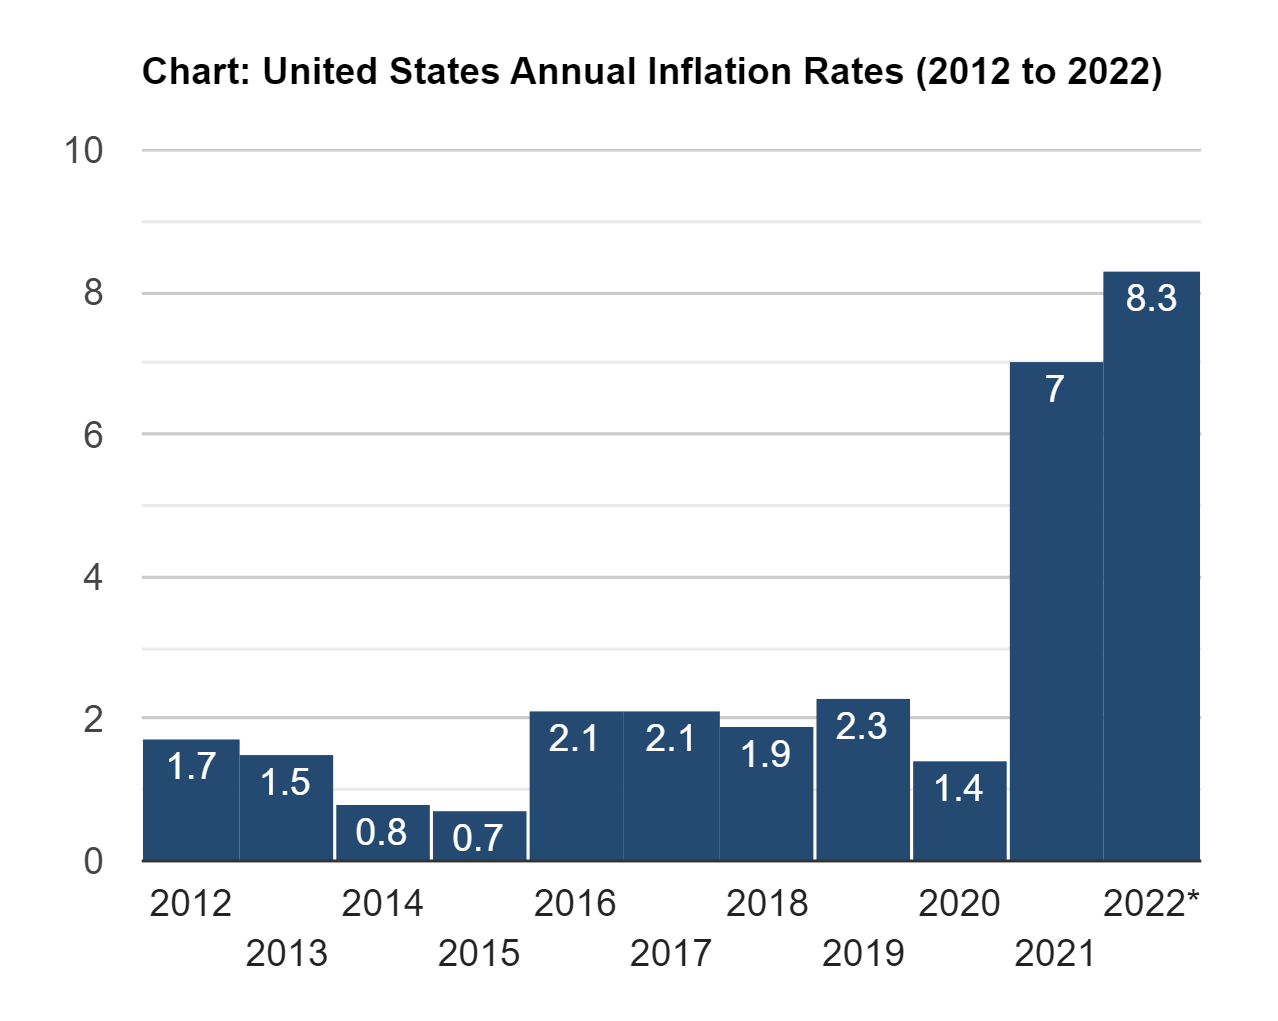
First and foremost, inflationary pressures in April rose 0.2% year-over-year. Although inflation continued to rise in April, the gain of 0.2% is a welcome deceleration when compared to the 0.9% gain in March. On a monthly basis, today's report revealed a slight decline in inflation from 6.6% in March to 6.3% in April. This is the first decline in a year and a half.
A Glass Half Empty
Because both the CPI and PCE inflation indexes showed fractional declines, month-over-month concerns remain elevated. Inflation is still at an extremely elevated level at levels not seen in the last 40 years. While the reports indicate a fractional decline in overall inflation, it does not take into account certain sectors which continue to spiral out of control. According to the BEA, energy prices increased by 30.4%, and food prices increased 10% in April. In other words, essential goods such as food and energy continue to spiral higher with no data to support that these costs will abate anytime soon.
Inflationary pressures began as the global recession began to conclude, and pent-up demand exceeded the ability of companies to produce and ship those goods. However, new events have put pressure on Bitcoin which is forming its ninth red weekly candle, having broken through key support levels of $44k last month and $37,500 in May, declining by $15,000 the last two months.
When we do a Fibonacci retracement from the lows preceding the last two parabolic rallies (2017, 2020 – 2021) and compare them to the highs achieved in the second ATH made from that point, we get some very interesting numbers. The first retracement in black has its 61.8% level right at the recent lows of $25,211. The second retracement in blue gives us a 61.8% at $28,862, the price which we are labeling as a triple bottom.
A bounce off of a 61.8% retracement can be seen as a bullish sign. Visa-versa, a rejection at a 61.8% level can serve as a bearish signal. For that reason, BTC's defense of this key Fibonacci level and the triple bottom is the most critical battle for Bitcoin bulls. The fact that this support has remained intact is one of the few technical arguments for Bitcoin remaining in a bullish mode. Despite the swift beating that Bitcoin has taken recently, only one day since 2021 has BTC closed barely below this critical support of $28,860.
As of 4:20 ET, Bitcoin is currently trading at $28,900 after recovering from lows of $28,300 earlier today. Even on May 12, when we hit the lowest price since Dec. 2020, the small body of the candle actually closed above the $28,886 retracement/support level. Also, let's not forget that this level did serve as a bottom in the Summer of last year before rallying to a new ATH.
Storm Clouds On The Horizon
It's not all sunshine and roses when we zoom in on a daily chart. The Ichimoku Cloud tool is forecasting lower prices as being highly likely due to the size of the cloud and that it is above pricing.
"The Cloud is an integral part of the technical indicator as a whole and helps traders and investors identify the specific calculations made to the chart. Price below the cloud indicates a downward trend, whereas price above the cloud indicates an uptrend. These trend signals can strengthen if both the cloud and the price are moving in the same direction. Similarly, the signals can weaken if the cloud is moving in the opposite direction." -Trading View
My cloud charts do not include some of the normally included lines, such as the baseline and the lagging span. This is done on purpose to make the chart less chaotic and easier to decipher. The one line I do leave in beside the two that form the clouds is the conversion line that is shown in blue, and this short-term moving average of sorts has proven to be resistance for BTC for the last three days.
Both energy and food costs and those pressures continue to this day.
According to the New York Times, "The slowdown in inflation in April was largely the result of a drop in the price of gasoline and other energy. Gas prices soared in February and March largely because Russia invaded Ukraine, then moderated somewhat in April. They have risen again in recent weeks, however, which could push measures of inflation back up in May. Food prices have also been rising quickly in recent months, a pattern that continued in April."
Additionally, China's recent uptick in Covid 19 infections has caused a major decline in the delivery of exported products globally. Collectively China and Russia continue to impact the supply chain issues and bottlenecks.
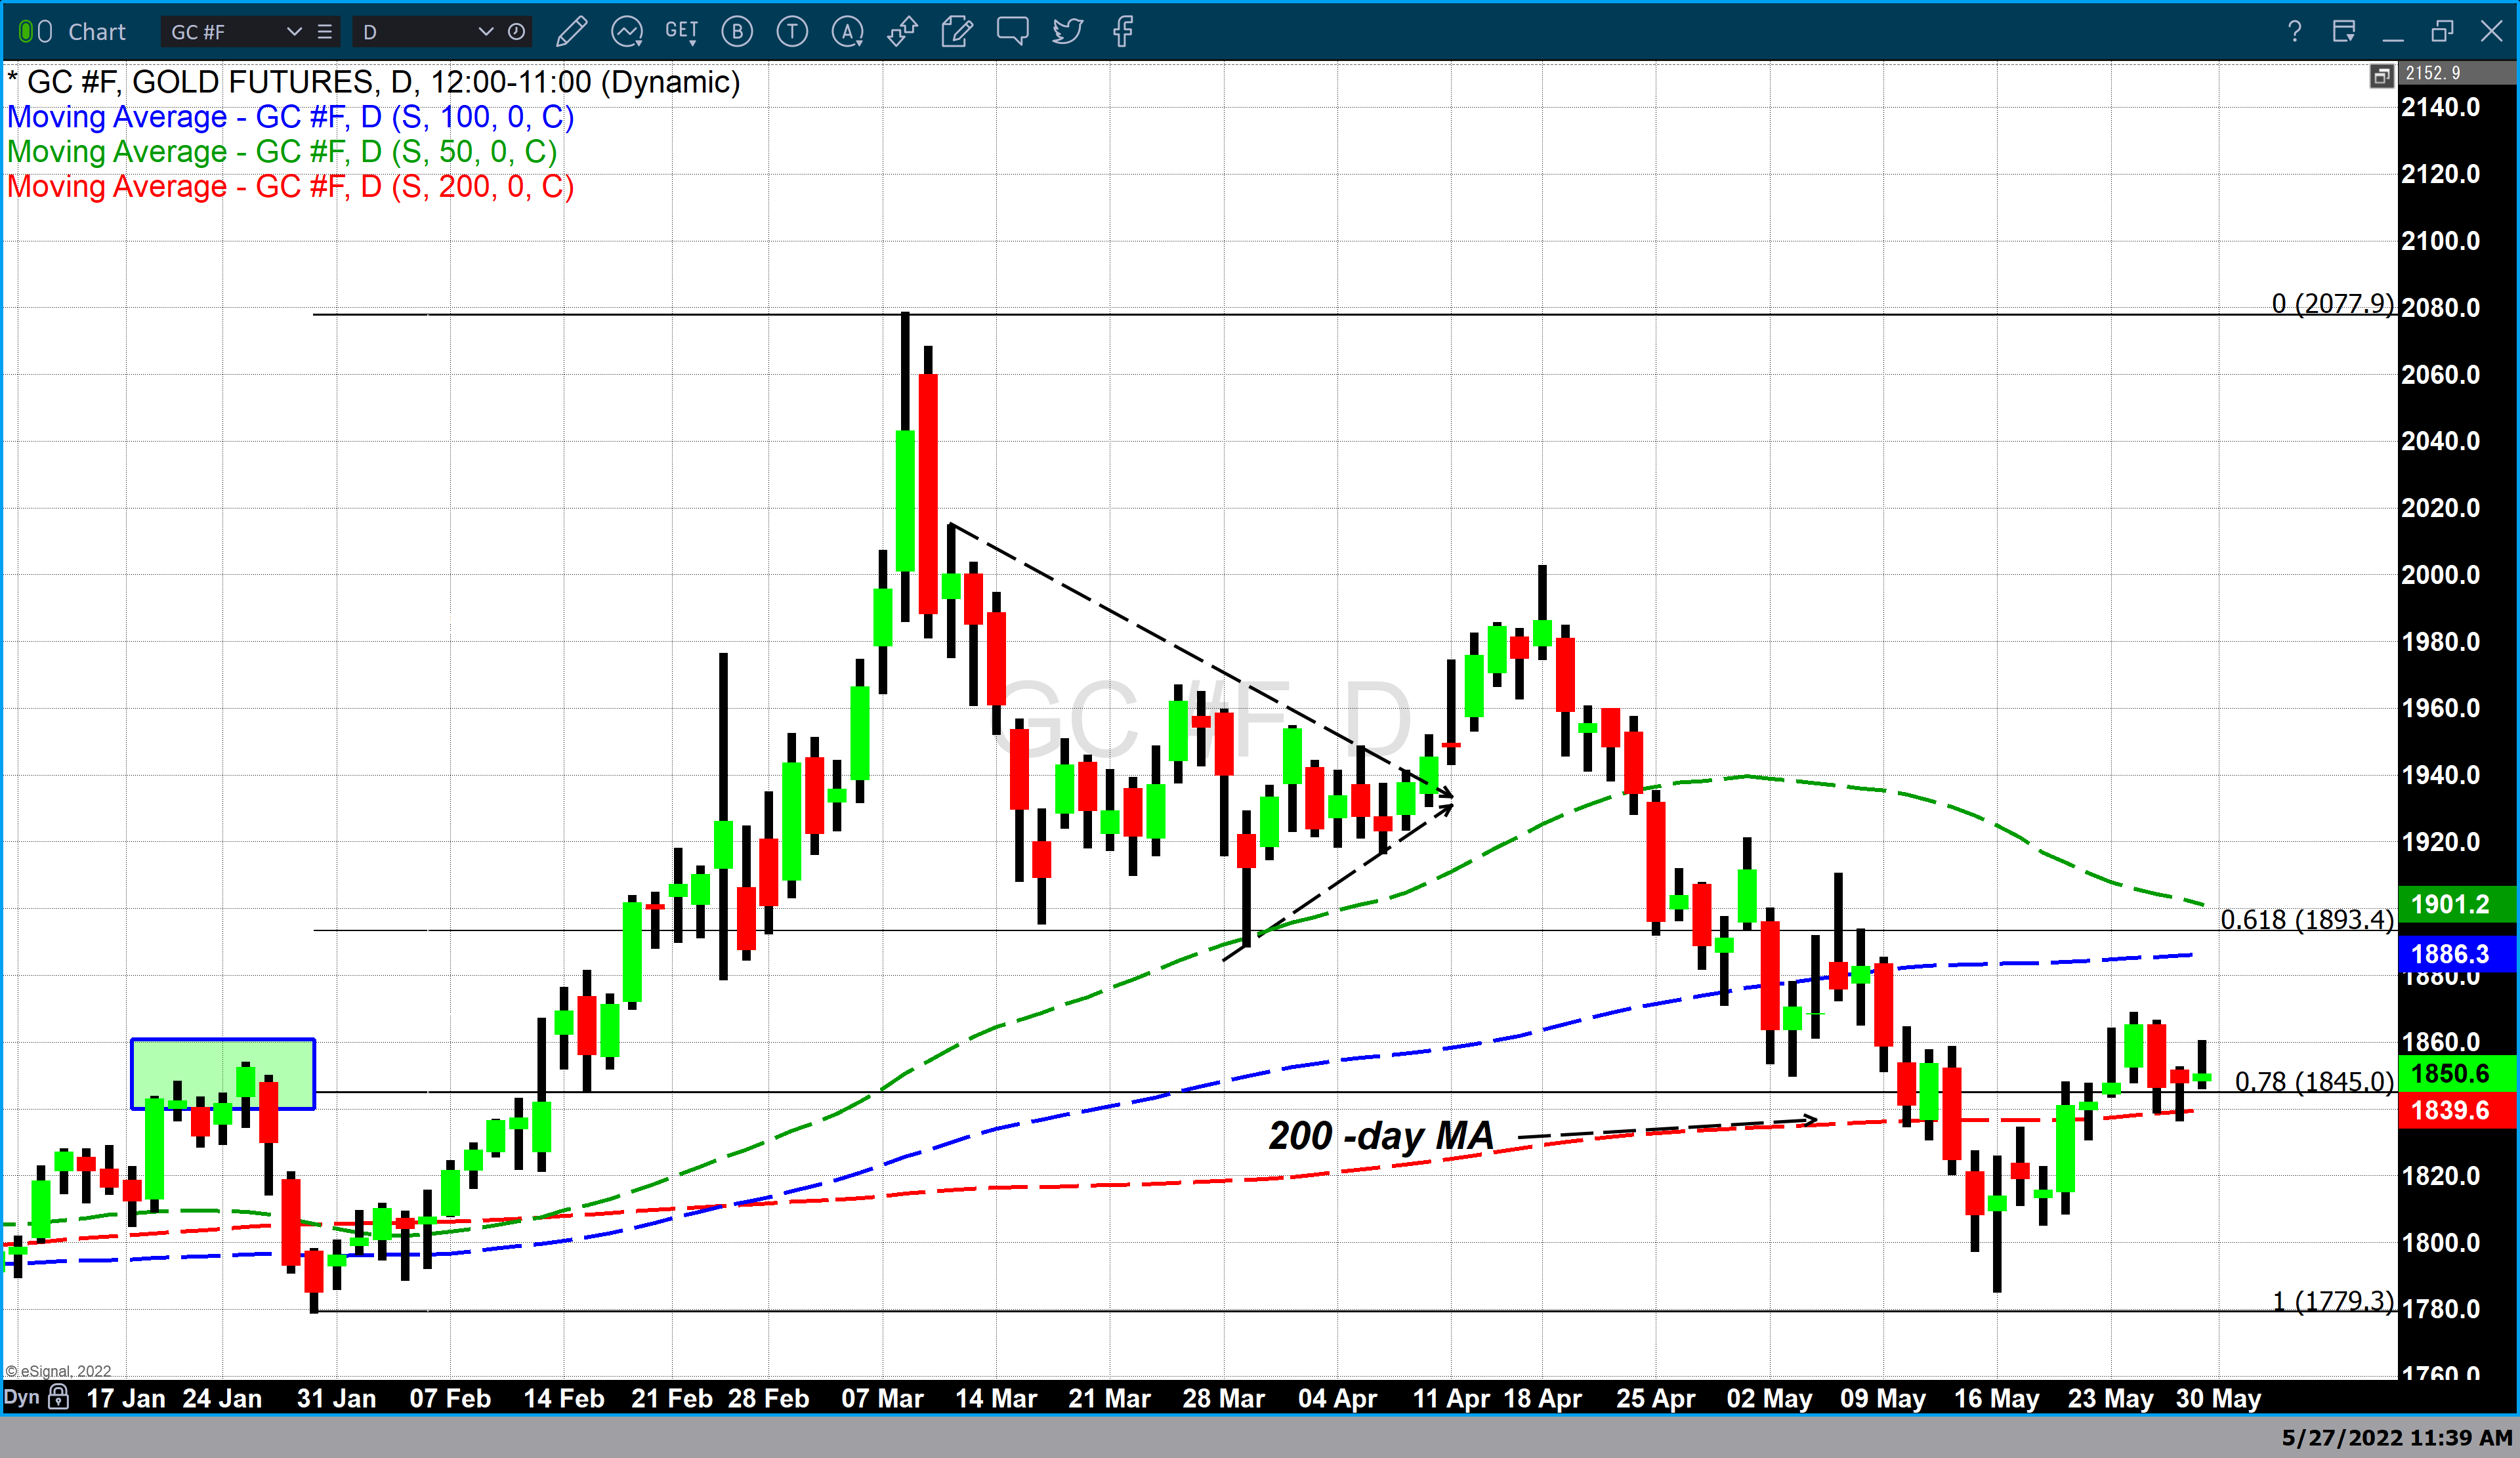
Gold had moderate gains with the June 2022 futures contract currently fixed at $1850.60 after factoring in today’s gain of three dollars.
For those who would like more information simply use this link.
Wishing you, as always good trading,
Gary S. Wagner
The Gold Forecast