
Last week, crypto enthusiasts got a boost when the crypto market cap almost reached the mark of $1 trillion, the highest level since last November.
That very month, I shared with you the bullish signal in the Bitcoin chart I spotted then. It was a Bullish Divergence on the weekly chart of the main coin.
Below is the distribution of your opinions on that bullish alert.
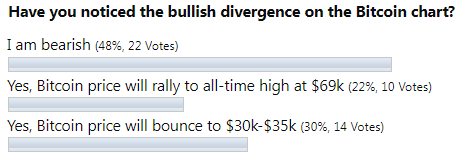
The "I am Bearish" option had gathered the most votes. The second largest bet was to see Bitcoin bounce back towards its prior consolidation area at $30-$35k. The price of digital gold was $16.5k at that time.
Before we check what happened to the price of Bitcoin since then, let us review the major crypto market.
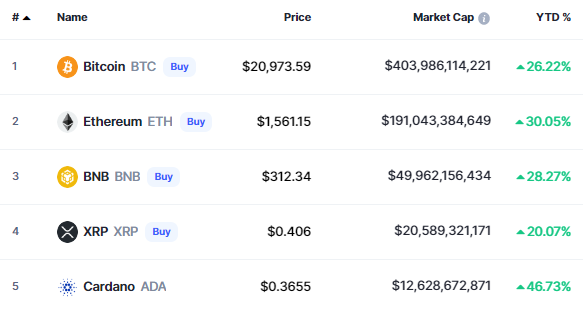
These are the five largest cryptocurrencies in the table above. Top coins are monumental at #1 Bitcoin with gain of 26% year-to-date (YTD) and #2 Ethereum with profit of 30% YTD. Binance’s native coin BNB has attained #3 spot (+28% YTD) long ago, surpassing the Ripple, which is now only #4 with gain of 20% YTD. Cardano closes the ranking at #5 with the largest gain of 47% YTD.
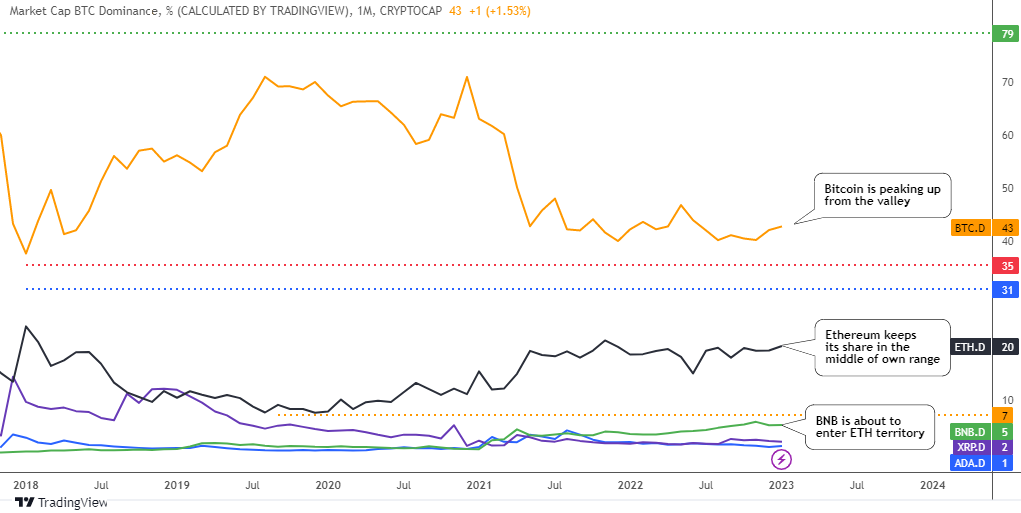
The chart of dominance has barely changed since November, with the main coin (orange) peaking up from a valley of 40% to 43%. Ethereum (black) keeps a stable share of 20% in the middle of its own range. BNB coin (green) dominance share has peaked at 6% and is cooling down now to 5%. This is about to enter the Ethereum area that starts at 7%. Ripple (purple) has been stuck around 2% for a long time. Cardano (blue) saw its maximum in the summer of 2021 at 4% and now is trying to push off the bottom of 1%.
Now let me show you the updated weekly chart of Bitcoin.
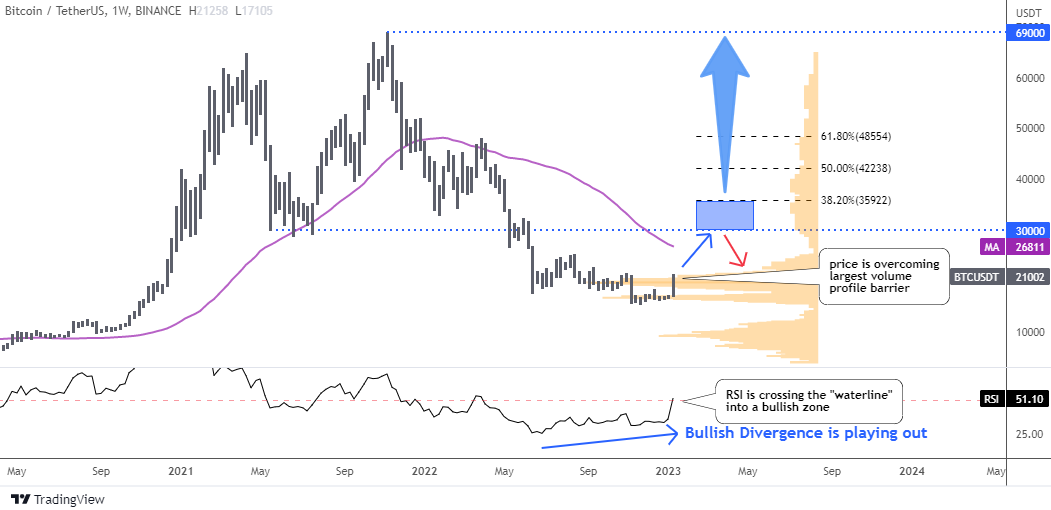
This is that very chart posted in November.
Firstly, let us quickly check the main alert that came from RSI in the sub-chart. Indeed, the Bullish Divergence has been playing out as projected.
The price finally established a higher low at $16.2k last December and a higher peak at $21.2k last week. The RSI indicator is crossing the 50-point line now and entering a bullish zone.
The price is moving north overcoming the largest volume profile barrier (orange) at $20k. The previous peak of $21.5k is within reach now. The next hurdle is the 52-week moving average (purple) which stands at around $27k.
The $30-$35k blue box area will be the next target for bulls. Price reaction in this zone will provide clues to the direction of a future move.
Is ‘crypto spring’ finally coming after a long suffering ‘crypto winter’?
On hearing the news that the notorious FTX exchange has recovered over $5 billion, the crypto market exploded. It is too early to judge if this is the global reversal or just a ‘dead cat bounce’.
Despite mixed market sentiment, the bullish impulse should not fade until it touches the moving average around $27k to convince the trading community.
To attract more buyers, the price should show a strong rally followed by a minor correction to let FOMO buyers in. The $20k area would act as strong support when the price climbs high enough.
Intelligent trades!
Aibek Burabayev
INO.com Contributor
Disclosure: This contributor has no positions in any stocks mentioned in this article. This article is the opinion of the contributor themselves. The above is a matter of opinion provided for general information purposes only and is not intended as investment advice. This contributor is not receiving compensation (other than from INO.com) for their opinion.