
Last month, I presented three potential scenarios for the future price of gold in an earlier Gold Update.
In the poll, most of you chose the green path, which suggested an extended period of consolidation for the yellow metal. However, it appears that the blue (straight bullish) and black (similar to the pattern observed in 2017) paths are more accurate, as the green path is no longer viable.
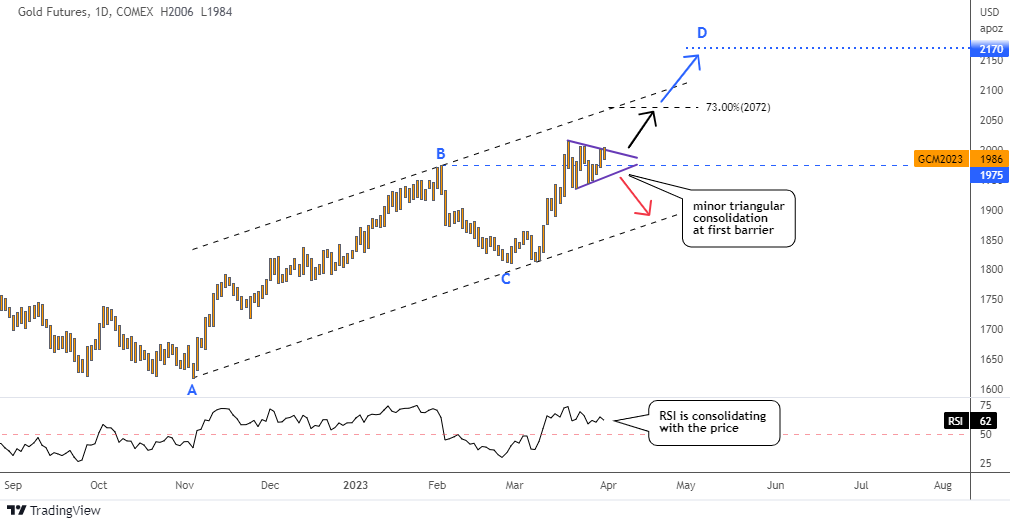
In just two weeks since the last update, the price of gold futures has increased by $160 or nearly 9%, reaching a high of $2,015 on March 20th. This surge in price caused the previous top at the blue B point of $1,975 to be broken, but the price has since been consolidating around this level.
The price of gold futures has formed a triangle pattern (purple) characterized by falling peaks amid rising valleys. The size of the pattern is relatively small, and last week, the price attempted to break out of the pattern to the upside but was unsuccessful.
As a result, the upside potential of the move may be limited due to the small amplitude of the pattern.
Based on the black dashed uptrend channel, the resistance around $2,100 could limit the upside potential for gold futures.
The black path, which is based on a 2017 sample, suggests that the move to the upside may reach up to 73% of AB move. To illustrate this, 73% of AB move has been added to the chart, and it is located at $2,072, which is slightly below the uptrend's resistance around $2,100.
In order for the price of gold futures to continue its bullish momentum, it will need to break through the double barrier mentioned earlier. This will clear the path for the blue target of $2,170.
However, if the triangle pattern breaks down, it could trigger a bearish move and lead to a test of the downside of the uptrend at around $1,870. It remains to be seen which path gold will take in the coming days and weeks.
Back in November 2022, I identified a bearish Head & Shoulders pattern in Tesla's chart in my post titled "These Stocks Are Falling Knives".
At the time, the stock was priced at $207, and I predicted a bearish movement. The majority of readers chose the conservative target of $120, which turned out to be the closest call as the stock hit a valley of $102 in January of this year. Congratulations with a huge gain.
The tables have turned, as can be seen in the following weekly chart of Tesla's stock.
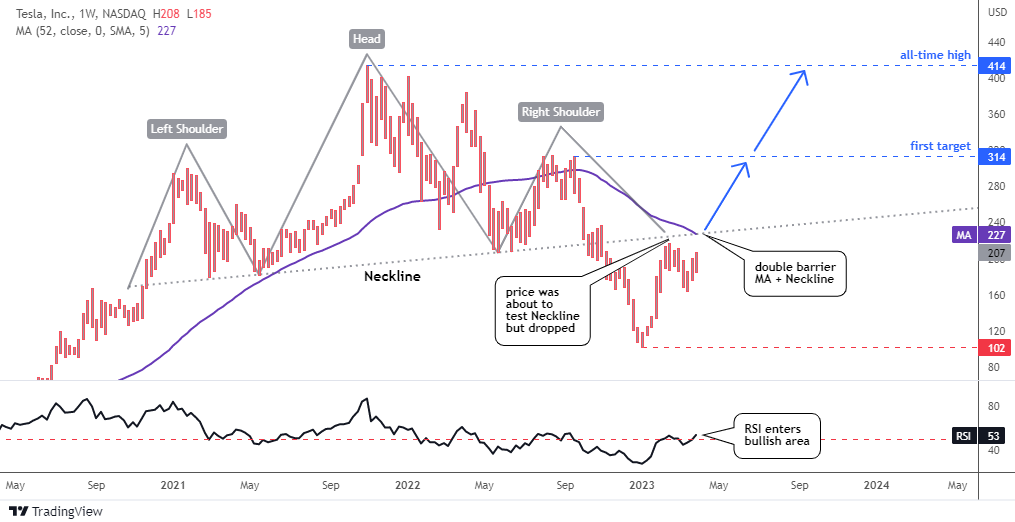
The stock price has experienced a sharp reversal, forming a V-shape pattern after reaching a low point of $102 at the beginning of the year. The Tesla price has approached the earlier broken Neckline (gray dotted trendline) of the Head & Shoulders pattern in the middle of February, but at that time, a test and breakout were not detected.
Instead, the price experienced a sharp drop from the top of $218 down to $164, retracing about half of the gains from the earlier valley.
As of now, the Tesla stock price is experiencing a strong bullish momentum, with it already surpassing the $200 handle once again. However, this time the Neckline barrier is stronger with the presence of the moving average (purple) at around $227. In order for the market to clear the path to the first bullish target of $314, the price needs to overcome this reinforced barrier.
The Relative Strength Index (RSI) is currently indicating a bullish trend as it has crossed above the key level of 50 and is continuing to move higher. This is a positive sign for the stock and suggests that the buying pressure is gaining momentum.
The support level for Tesla is now at $164, while the ultimate target is the all-time high of $414.
Intelligent trades!
Aibek Burabayev
INO.com Contributor
Disclosure: This contributor has no positions in any stocks mentioned in this article. This article is the opinion of the contributor themselves. The above is a matter of opinion provided for general information purposes only and is not intended as investment advice. This contributor is not receiving compensation (other than from INO.com) for their opinion.