
Gold price came very close to hitting the double barrier at $2,070-$2,100 of the black path target and the upper boundary of the bullish trend channel outlined earlier this month. The new 1-year top has been established at $2,063.
You were amazingly accurate this time as most of the votes were for the black path to lead the way. The market has since reversed to the downside, raising the question of whether it was a hard top or a glass ceiling.
To answer this question, let me show you an updated chart below.
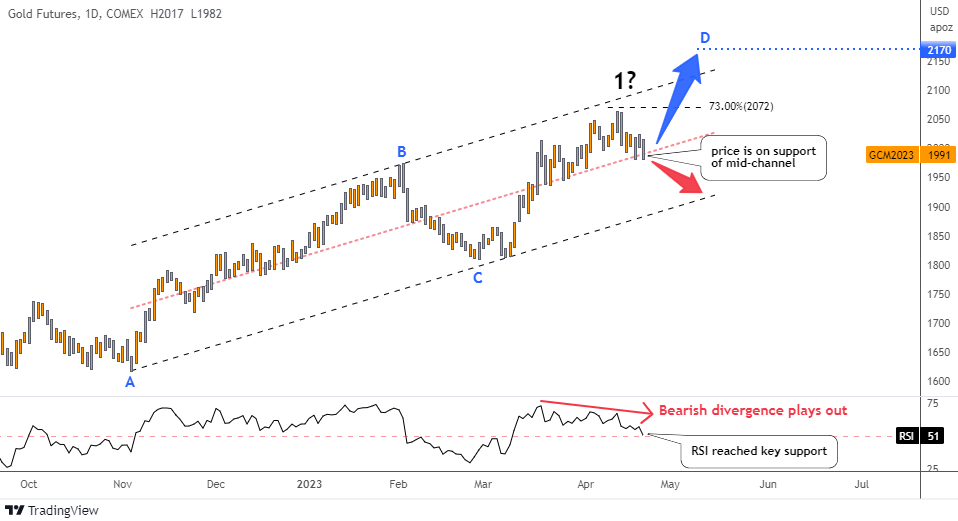
The price has slid down to the pink mid-channel support within the black bullish trend channel.
In the RSI sub-chart, we can clearly spot a bearish divergence as the falling peaks didn't confirm the new top in the price chart. This has been playing out, pushing the price down. The indicator's reading has reached the key support of 50, just like the price.
Let us watch how the price would react at this double edge of the mid-channel and the RSI’s support. The price still could bounce to the upside and challenge the recent top as well as the upside of the trend.
The bearish signal would come on the breakdown. In this case, the black path would be confirmed and the top of $2,063 would act as a peak of the first large move to the upside.
In the following chart I will zoom out and share a bigger picture on the weekly time frame.
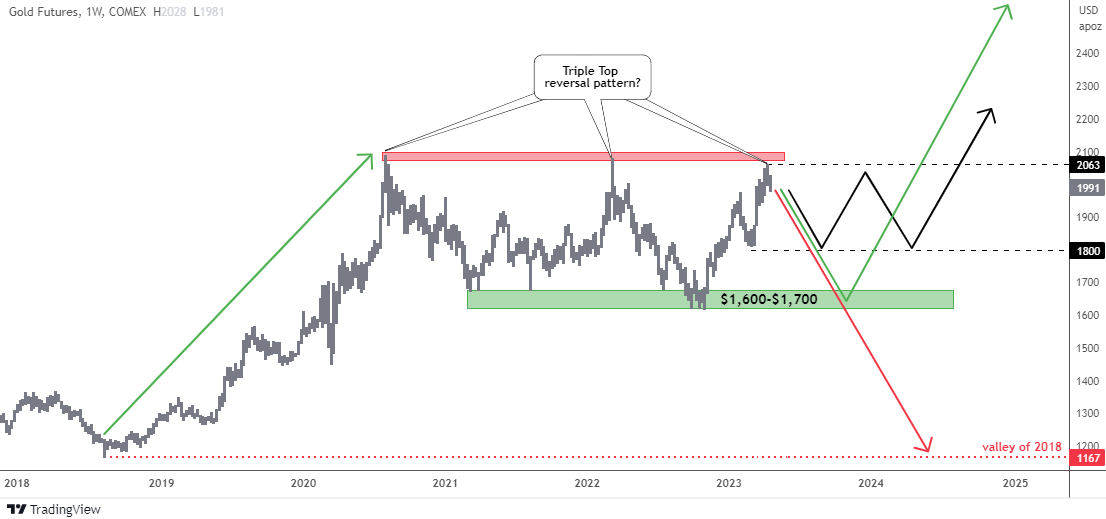
This could be an eye-opening chart with three major scenarios. Sometimes it is worth to zoom out of short time frames and squeeze the chart to see a bigger map that appears.
The gold price chart is showing a potential Triple Top pattern, which poses a major risk for the price. The pattern is formed by three peaks in the same area between $2,000 and $2,100.
If this pattern is confirmed, it could be unpleasant for gold investors as the price would be expected to retest the valley of 2018 at $1,167, which is where the previous major bullish move had started (red arrow).
It seems that the black path may have been the preferred option before taking a broader view of the chart.
However, upon examination of the chart, it appears that the current top may just be the first move up, which has been retraced within a middle-sized consolidation. It is anticipated that after completion of the consolidation, another move up could potentially reach the $2,200 area.
The green path suggests that the zigzags between $2,100 and $1,600 represent a large consolidation, but the final move down to retest the green box has not yet occurred for completion. Once that happens, a large upside move of greater magnitude could potentially emerge, reaching the $2,500 area.
Intelligent trades!
Aibek Burabayev
INO.com Contributor
Disclosure: This contributor has no positions in any stocks mentioned in this article. This article is the opinion of the contributor themselves. The above is a matter of opinion provided for general information purposes only and is not intended as investment advice. This contributor is not receiving compensation (other than from INO.com) for their opinion.
Dear Frank,
Thank you for regularly sharing your thoughts as you brought up the strong point this time.
This polarization of the world only grows over time.
Gold is only one element as you highlighted oil.
We also see the new race in chip, AI and overall IT industry.
Again, thanks for reading, have a good one,
Aibek
It all depends on what day the Russians announce they will only accept gold or Brics for their oil. That is inevitable since few nations have the Brics and few nations will do this voluntarily since it is strictly a political maneuver and there will be no choice for some but to buy gold regularly on the open market creating demand, while the need for vast reserves of US dollars will decline.