
“It's not gods who make pots” as investors move the market, pushing the buttons and sending the orders to the marketplace. It’s clear that they tend to behave one way or another, and that’s why patterns exist and appear from time to time as “there is no new thing under the sun.” It doesn’t matter what the instrument is it, let it be a very old commodity or a new digital asset, it is people who “worship” it, make it valuable and move the price of it.
Bitcoin caught the hype again recently after a disastrous 2018 when it was just falling all way down. I would like to share with you an interesting similarity in the chart structure of “perpetual” gold and Bitcoin aka “new gold” to find out if this rally is a part of something bigger.
Let’s start from the monthly gold chart as it is a model for the Bitcoin chart.
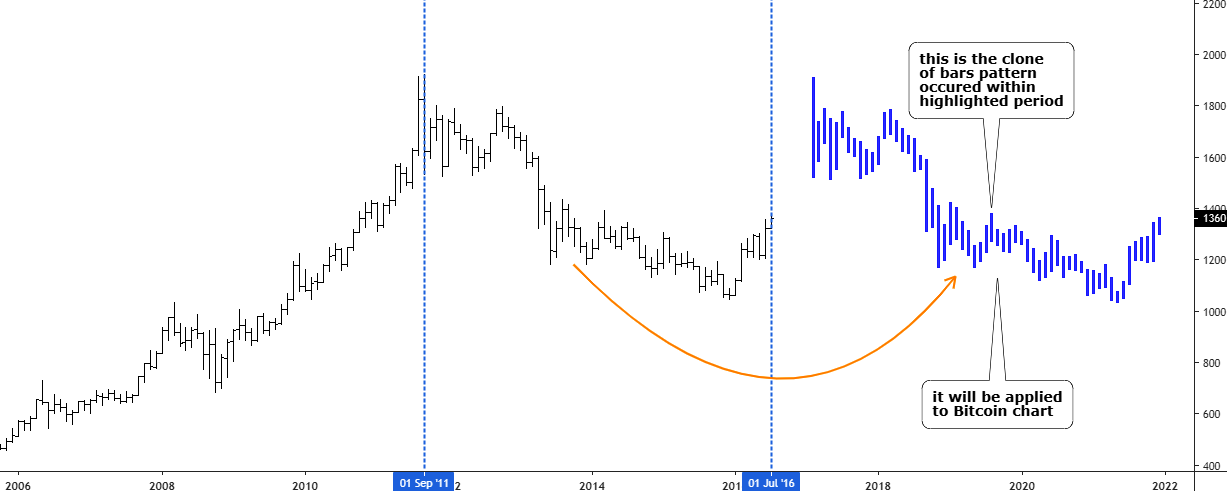
Chart courtesy of tradingview.com
There is a period between September 2011 and July 2016 (highlighted with blue vertical lines) on the monthly gold chart, which looks very similar to what we can see on the Bitcoin chart. To show it, I copied that clone of the bars pattern for the above mentioned period of time (blue), and I am going to apply it to the weekly Bitcoin chart in the next chart.
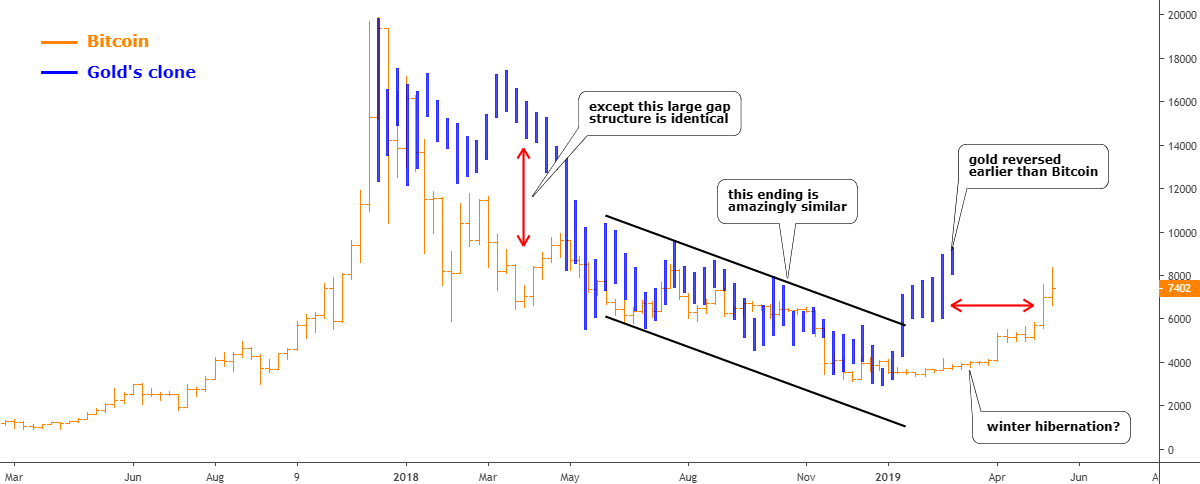
Chart courtesy of tradingview.com
For the visual contrast, I colored the Bitcoin bars in orange and gold’s clone bars in blue as in the first chart above. To remind you, the time frame of the gold chart was monthly, and the size of the clone is almost equal to 5 years. Here in the Bitcoin chart, the time frame is lower as it’s a weekly chart, but you shouldn’t worry about it as the main idea is to show you the structural similarity. The sleepless Bitcoin, which runs 24/7, passed the gold’s clone 5-year period in just 18 months.
The very beginning of the blue clone on the Bitcoin chart doesn’t look bad, but then the gap increased in the winter of 2018 reaching the extreme in April of the same year as gold was digesting the shock from the all-time high price much longer. Bitcoin investors were nimble to take their profits and spurred the huge wave of the sell-off, which erased more than 70% of Bitcoin price very quickly. The meltdown of gold’s clone followed, and it caught up with Bitcoin in May of 2018 as crypto investors, on the contrary, were digesting the shock from the huge drop of the digital coin.
I highlighted the end of the drop in the first leg with a black downtrend channel. This is an area where both instruments just got amazingly synced. This is what I call the similarity of the structure. It’s quite a natural outcome as each market stage reflects the current investors’ mood or emotions that drive the market or dries up the volatility as it was seen in the next stage after the ending in Bitcoin.
We can see how gold’s clone reversed quickly to the upside after the completion of the drop while Bitcoin had winter hibernation. Nevertheless, later on, it caught up with the gold’s clone and reached above $8000 confirming the structural similarity.
Here the history of Bitcoin ends and now we can add the prospects with another clone of the gold price to see if the similarity would persist there also.
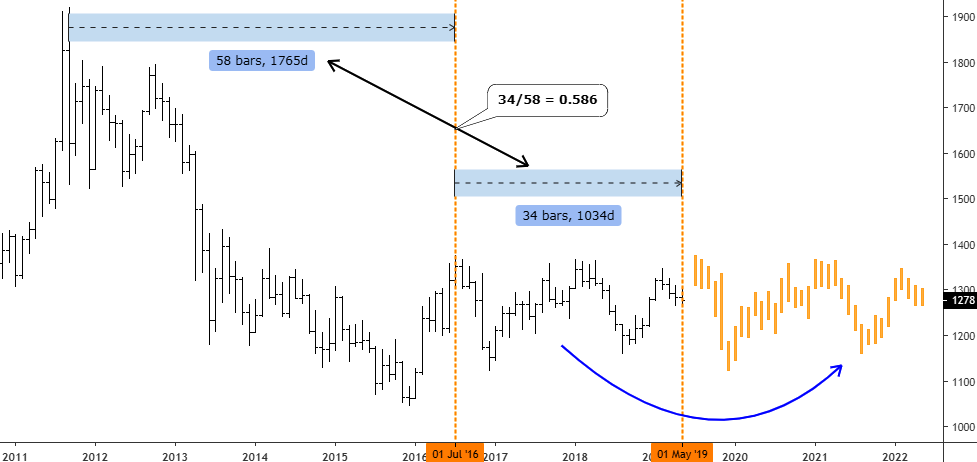
Chart courtesy of tradingview.com
This time I copied the bars pattern that occurred from July 2016 till these days (orange). This area of long-lasting consolidation could be repeated in Bitcoin. In gold, we expect the completion of that consolidation with the breakout higher in the last leg up.
This time I also measured two periods: 1) from the all-time high till the top of reversal; 2) consolidation. I did it to find the ratio between the periods (0.586) to apply it to the Bitcoin chart to keep the visual proportion there.
Let’s see what prospects of Bitcoin appeared.
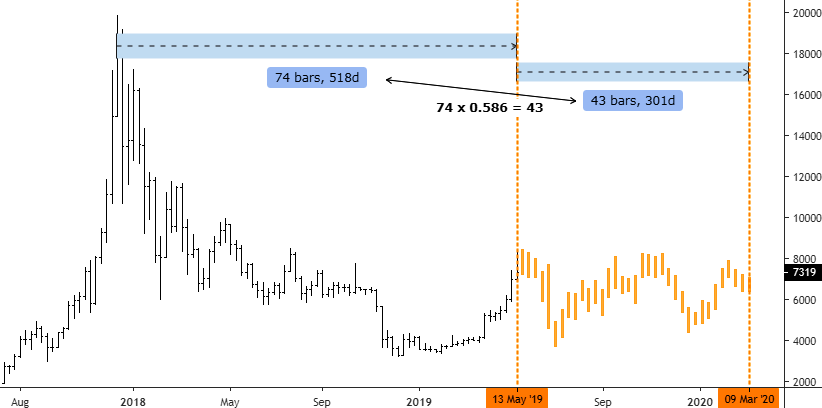
Chart courtesy of tradingview.com
So, gold’s clone was added, and the proper ratio between periods was obeyed. What do we have there? The clone implies the range trading for the upcoming 43 weeks between $3600 and $8300. Let us live and see.
Intelligent trades!
Aibek Burabayev
INO.com Contributor, Metals
Disclosure: This contributor has no positions in any stocks mentioned in this article. This article is the opinion of the contributor themselves. The above is a matter of opinion provided for general information purposes only and is not intended as investment advice. This contributor is not receiving compensation (other than from INO.com) for their opinion.
Lay the 10-Year U.S. Treasury Note chart on both Bitcoin and gold and see what you get. Cheers, Jim
I get a downtrend???
Dear all I am reading this because I follow ino.com part of Marketclub which I use to be a member back in April the bitcoin chart broke through 3 month high around $4200 and gave me a signal to buy I bought it in xbt € 500 it has doubled now I wish I bought more. So far I haven't found a tool better then the 3 month high or low for the opposite. It's the true reflection and the simplest of what is going on in the market cutting all the rest. Regards Lucio.
Thanks for the article. Do you think the supply of gold and bitcoin are increasing at about the same rate?
Dear Dave, you are welcome and thank you for reading! Replying to your question I could tell that there is always a disbalance in the market when the structure changes and it has a strong trend.
Hi Aibec .
I would like to comment about your comment , If I am aloud to .
It's not gods who make pots” as investors move the market,
This comment is right and wrong ? The wrong first , Someone has moved the market yes , but it was not an investor who did move the market , it was someone secret who did it . They control the trend up or down
The right ,, we as little investors cant move the markets with our small lots much even combined , most little average investors traders want too get the best price usually , and this does not push up the market much or hold it their . It takes real power and volume to control trends . The proof is in the open . You will need a lesson on wave counting , This is what I can offer .
Gold is heading down slowly , bitcoin has not finished its wave up , in my opinion . Though I don't trade bitcoin or trust it .
Dear Mark, my name is AibeK. Thank you for your time and thoughts.
I think there is a contradiction between "real power and volume to control trends" and "You will need a lesson on wave counting , This is what I can offer".
Have a great time ahead!