
Last month I spotted the reversal Head & Shoulders pattern on the daily gold chart and shared it with you. Let’s see how it played out.
I entered the replay mode on the chart below and deleted the bars that appeared after the previous post to show you what I was expecting from the Head & Shoulders pattern. I would like to add more educational annotations for you in this post.
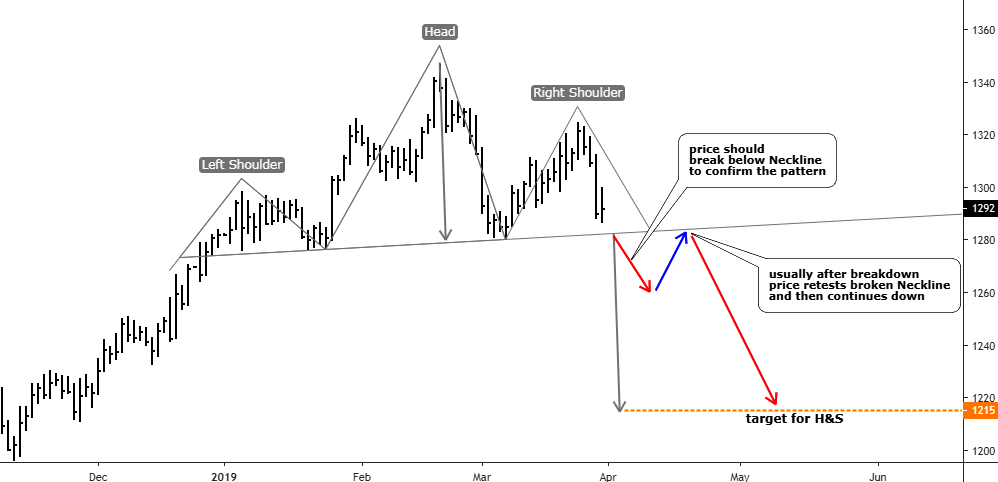
Chart courtesy of tradingview.com
The previous annotations were switched to gray except the target level for the Head & Shoulders pattern. So, what I was expecting to appear on the chart? First of all, there should be a breakdown below the Neckline, which would confirm the pattern (short red down arrow). Usually, after the breakdown, the price retests broken Neckline (blue up arrow). Only then, the market continues its move in the direction of a target (long red down arrow).
Now, let’s see how it actually played out in the chart below.
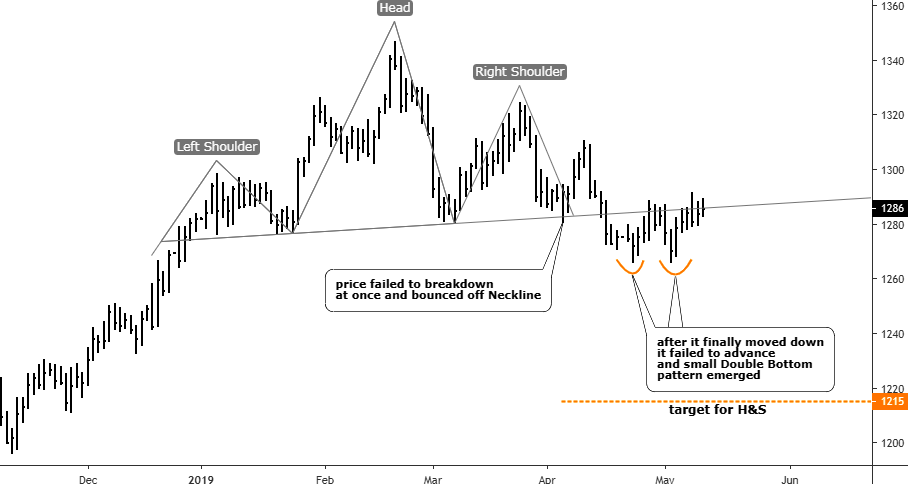
Chart courtesy of tradingview.com
Gold couldn’t break the Neckline at once as it bounced off it and that reverse even threatened the former top, which is not good. Then the price finally moved down through the Neckline, but it failed to advance to the target area. I highlighted with two orange semicircles the small Double Bottom reversal pattern, which was established lately. This is not what I was expecting as you can compare for yourself with the first chart above. The price couldn’t trigger both target and invalidation levels. It hovers around the Neckline, so it is better to exit the trade if someone is in as the pattern doesn’t behave as planned.
Let’s zoom out and come back to the master weekly chart, which was posted in January. Maybe we can find more clues there now as time goes by and the structure gets clearer.
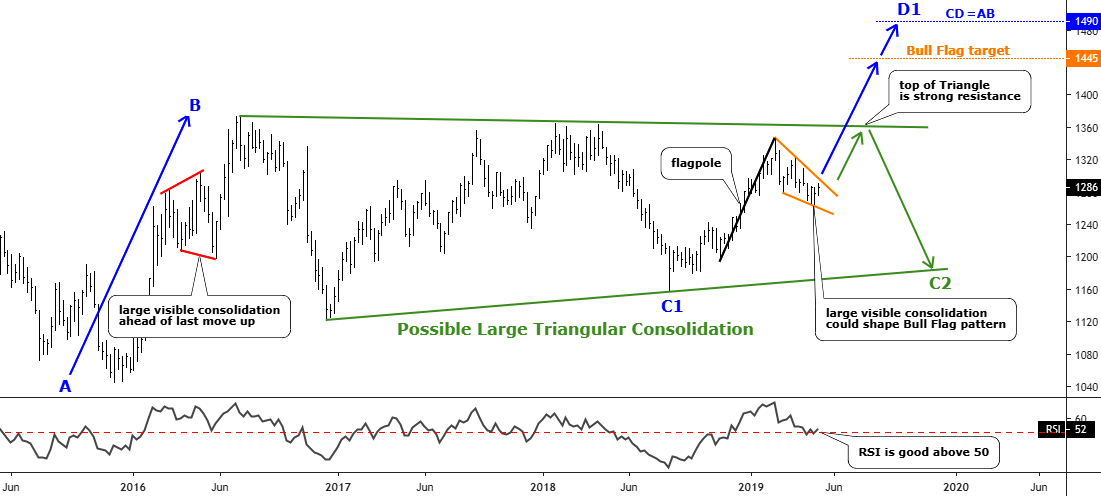
Chart courtesy of tradingview.com
In this updated weekly chart I switched off the 3rd option (red C3-D3), which implied more weakness for the gold before the second leg up to emerge as we don’t see any severe drop of gold these days. I kept only two options highlighted in blue (C1D1) and green (C2).
Let’s focus on the first leg up (end of 2015) marked as the blue AB segment as I would like to draw your attention to the large visible consolidation (red diverging trendlines) that occurred ahead of the last move up in that first AB segment.
Now, let’s look to the right into the area, which was highlighted with orange trendlines, here we can also see the large visible consolidation, although it has a different shape. This price behavior could build a famous Bull Flag pattern. I added the black flagpole on the left for more visualization. This pattern adds chances to the simple option of the second upside leg (blue C1-D1). The target of the Bull Flag is located at the $1445 (flagpole distance added to the breakout point). To remind you, the target for the blue C1D1 is set $45 higher at the $1490 (CD=AB).
To hit the targets mentioned above, gold should first break out of the orange flag above the $1300 and then overcome the top of the green Triangle in the $1360 area. If it fails there, then the green option of the large triangle could come into force.
The RSI has kept above the crucial 50 level despite the strong downside pressure that occurred lately. It’s a bullish sign.
Intelligent trades!
Aibek Burabayev
INO.com Contributor, Metals
Disclosure: This contributor has no positions in any stocks mentioned in this article. This article is the opinion of the contributor themselves. The above is a matter of opinion provided for general information purposes only and is not intended as investment advice. This contributor is not receiving compensation (other than from INO.com) for their opinion.
IMO You do a good job with your TA, Aibek.
However although TA and FA are useful guides to use for potential targets to be reached, there is a problem and that is your "Federal" Reserve's manipulation. (I say 'your' because I'm not from America)
These bankers want the USD and the American stock markets to be strong but as gold has an inverse correlation to them, they want it's price kept low.
One method they use is to send their principal dealer, JP Morgan Chase, short silver because it's thinly traded and therefor easier to manipulate. Due of the nexus between the two, this brings the price of gold down. Therefore gold is probably best to trade short term if you believe the price is going to advance. IMO it's definitely not something hold for the long term.
It was a sad day in your history when the Federal Reserve Act was passed in 1913 and it was done when most of Congress was absent due to the Christmas holidays. You could say they struck while the iron was hot.
They should never be there in the first place. There will never be such a thing as free markets while these parasites hold all the aces.
You have a cup and handle at the end of this chart.
Hey Richard, kudos to you! Sharp eye!
It adds even more to the bullish side.
You inspired me to tailor Cup & Handle pattern right away on the chart.
Watch it at https://www.tradingview.com/x/nIBVXufR/
Thanks it was great!
All this support level stuff is hocus pocus baloney. Gold has gone nowhere for years and all the discussion above is not based upon any fundamental logic, just a bunch of malarkey.
The Chart tells traders what has happened and what will happen. No use reading all the stuff published - everything is in the chart - everthing -= learn to rely on a chart
Dear Herman, patience is always a key. If chart doesn't change it means it's too high time frame I think.
People trade from 1 minute up to 1 month and beyond. Its always a choice not the chart itself.
After such a huge rocket move in gold price there should be a large correction and we have it now.
Thanks for sharing!
First Head and shoulder pattern ... the answer to the above question is yes and no . its still relevant but I don't use it it is too basic technical analysis .
I agree with comments GOLD is going down next , over the next few years gold is heading below $700 USD .
Maybe this is going to be hard too believe , But I believe it is a fact . If you are a genius with wave counting then you would know , gold has just finished wave 3 with wave 4 in progress too be completed is a few years time .
Dear Wave Rider, Not gods make pots...patterns are what people see.
In distant 2016 I posted this chart here at https://www.ino.com/img/sites/ino/email/7359.jpg.
Also here a year ago at the https://www.ino.com/img/sites/ino/email/9549.jpg another approach but the same outcome
The large complex correction could be underway and we never know where and when it finishes.
And yes there is a chance it will dip sub-$1000 before we will see the reversal to the upside but its very very BIG chart it can take years to be completed.
Thank you for sharing!
Hi Aibek Burabayev (INO.com Metals Gold is a great topic , I am new to posting my opinions . Having a great deal too say
How can I post a chart of GOLD for all too see . I am not greedy , would rather teach what I can see . Technical Analysis is the way . For the initiated , their is advanced ways of seeing a chart . Not all the Technical Analysis charting tools give the best picture . But their are some indicators that in the right hands work with a vision into the future . We can not see the future
on a chart that is current , but we can see on a chart where we have been . This gives us vision of the past and vision of the future , when you know what to expect next . . If I talked about Golds past trend without having a chart to show this would be the next best way , if other see their own historical charts of GOLD . Back in around 2008 was higher wave 1 an 2 ,,, Then wave 1 and 2 ,, 2009-2010 wave 3 top was towards the end of 2012 ,, wave 4 bottom was towards the end of 2015 ,, wave 5 top was Feb 2019 this finishes the higher wave 3 top ,, Now looking into the future higher wave 4 down next ,, My target into the future is below $700 . Basic Technical Analysis can not offer this . Moving averages lets say a
3 ma and a 7 ma or a 7 ma and a 21 ma are great . I have found moving averages don't lie .
Ako USD = UP Gold = DOWN, Ako USD = DOWN Gold = UP
Dear klaki, thanks for sharing!
Hi Klaki . If your equation is right and that's it and their is no more .,, Ako USD = UP Gold = DOWN, Ako USD = DOWN Gold = UP ,,,
What if ? Gold down + Dow down together .
The USD is only a currency , gold is a commodity , and can be valued into any currency .
Maybe gold could be used to buy other things like property or goods , Without being a genius too know every detail of this equation . The USD is doing really good , but when it turns as it will heading down , and gold has not finished its down wave going down together
will this be proof , then that your equation above is not right . No offense
There is a support line you haven't shown.
I starts from the low in August 2018 (where you have C1)
It then makes 3 more touches. The last on being the low in the descending wedge.
.
Dear Bruster, you are absolutely right noticing the absence of the support line, in the previous post it was highlighted in the daily chart at the following link https://www.ino.com/img/sites/ino/email/10509.jpg.
It wasn't breached so I didn't put it in the "play-out" chart #2. It just adds more to the bulls' side.
On the weekly chart I focused on the pattern and skipped it.
Thank you for reading and sharing your thoughts here at INO, best wishes, Aibek
Gold needs to test succesfully the 200 MA (1250) before advancing !
Dear Deschamp, maybe you are right, thank you for sharing with all of us here. Best regards, Aibek
Always appreciate your insights and commentary. Love someone who can change gears if charts do not concur.
Dear Al, I am happy to share with all of readers here at INO and your warm comment adds quite a lot to my feeling!
We all struggle from time to time to admit that we are moving the wrong way, it's natural.
Just need to train ourselves to "change gears" as Mr.Market is always right, and better do it around the breakeven or at small cost. 😉
Have a great time, best regards, Aibek
I am short the S & P 500 big time for me. What is the trade in your opinion for the Long Gold. Please call out the target for the trade? please
Dear Nick, the crucial levels are all on the chart and in the text description. Best wishes, Aibek
Hi Nick I would like to comment , about your comment ,( I am short the S & P 500 big time ) . You may do ok if the wave 4 up at the moment has not beat you . Margin trading is dangerous . If you are inexperienced and put all your money on the line , this is bad . Things go wrong when we gamble . If you have to trade with margin , don;t put everything on the line or at risk .
My advice is to go very steady , try trading with the smallest amount of money when shorting , this will protect you from disaster . What we all need is experience , when it comes too trying new thing , so we know what too expect when things go right ,as well as when things go wrong . Be careful
Ps The S & P 500 and the Dow Jones trend about the same wave pattern , they follow each other . If you are still alive in this trade then next wave down will make you smile .