
The benchmark 10-year Treasury yield spiked to 1.61% last week for the first time in more than a year. The U.S. dollar, aka “King,” fought back to the upside on this growth of the yield. Investors ran out of other assets, including precious metals, and its price dropped.
Let us see the updated structure of the U.S. dollar index (DXY) in the chart below.
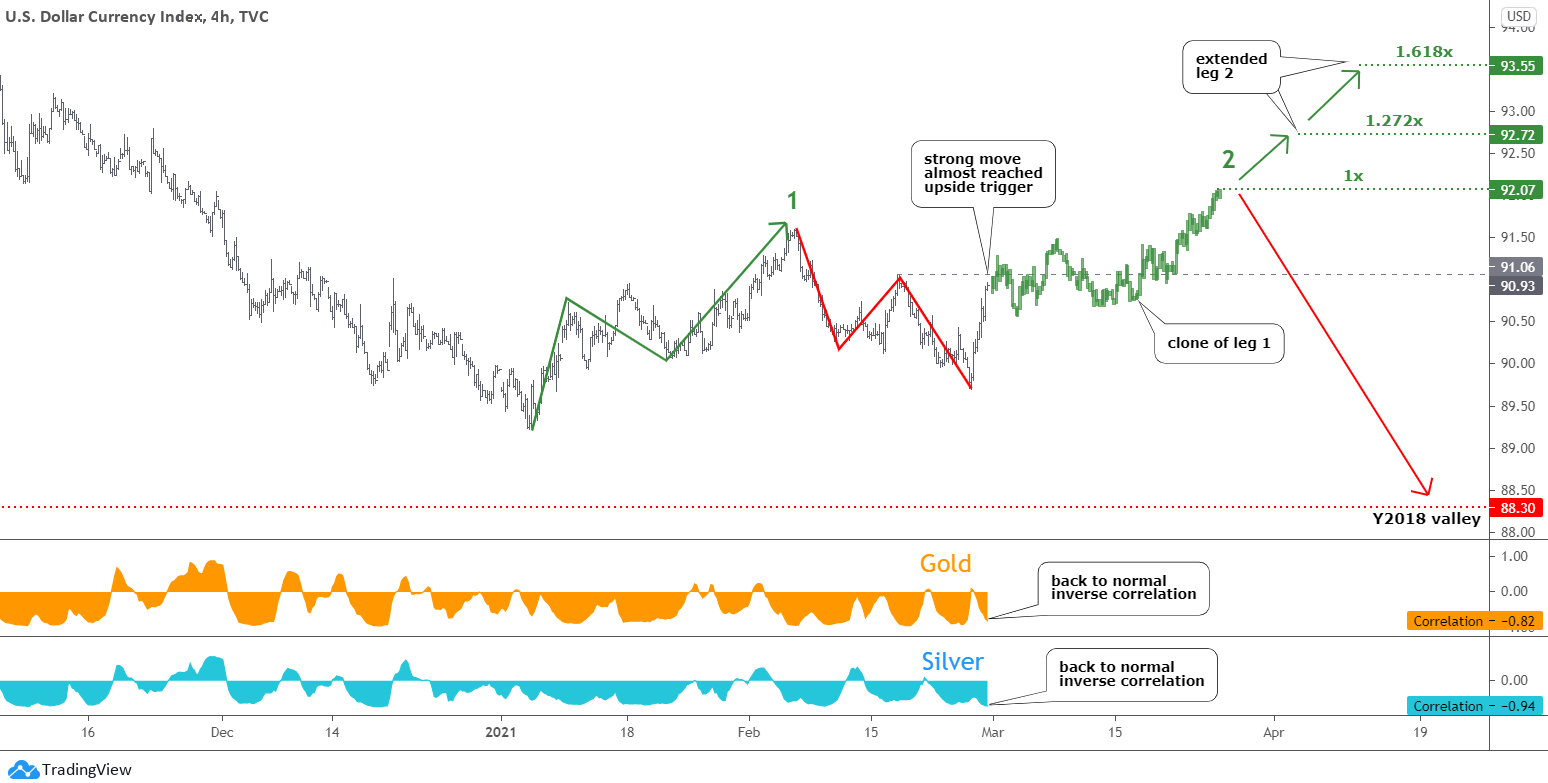
It looks like the DXY moves according to your favorite orange path to the upside that was published last week. However, the sharp drop below the earlier valley eliminated both scenarios.
I am looking for a more complicated consolidation to emerge. The entire green zigzag to the upside started last month was labeled as only the first leg to the upside. Before that, I considered this structure to be completed. The red zigzag to the downside makes a joint with a new second leg up. The initial move of it is powerful as it almost reached the upside trigger of 91.06.
I added the clone of the remaining part of leg 1 to the right to show you the possible path. The target area starts at 92.07, where leg 2 will travel an equal distance of leg 1. We cannot rule out the extension, so I added 1.272x and 1.618x multipliers to the chart. It is located at 92.72 and 93.55 respectively.
This move-in leg 2 up will put more pressure on precious metals as we can see on the correlation sub-charts that the regular inverse correlation is back.
Now, let us look at the daily gold chart below.
The trade-related option of “Wait for it (gold price) to move lower” gathered the most of your likes, and it paid well as gold sank lower as per red path published last week.
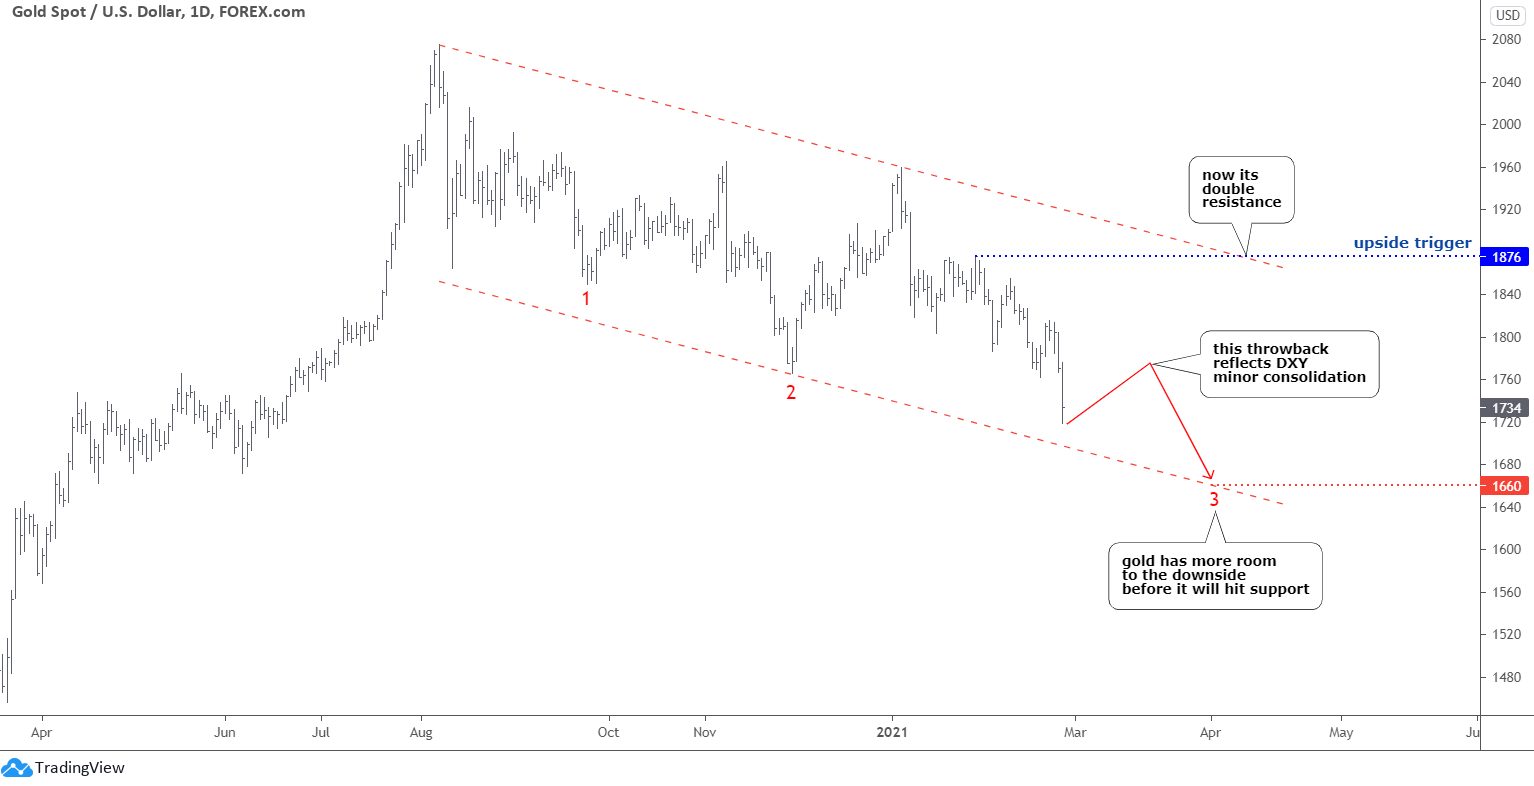
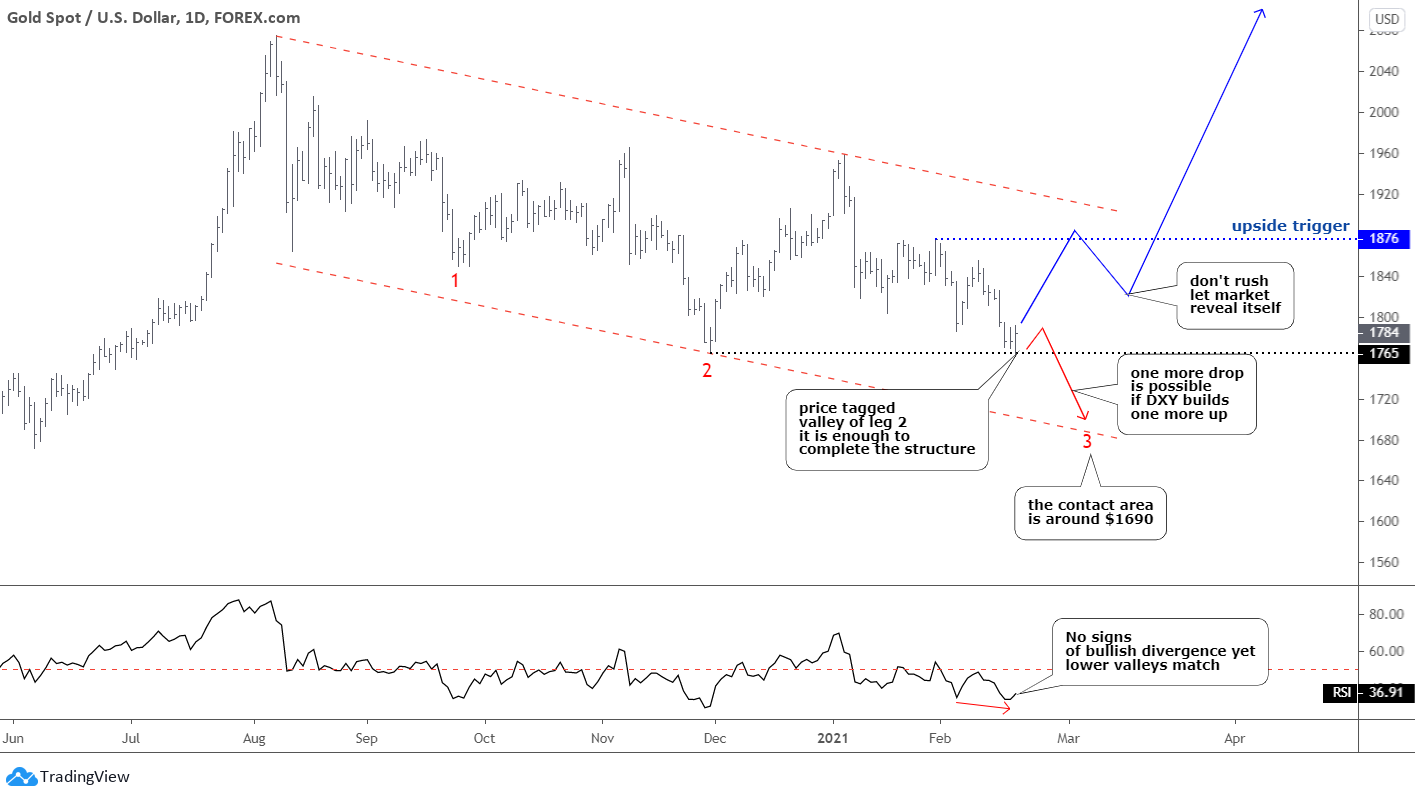
The overall structure did not change as the gold price looks for firm support after it breached below the minimum of leg 2 ($1765). The downside of the red declining channel could give us a clue, and maybe it can draw some demand there. I moved the contact point to the right in the $1660 area to fit with the DXY chart structure. The former could show a minor consolidation, which is shown as a throwback in the gold chart with the red zigzag.
These Stocks Are Ready to Break Out
Over 5K stocks are trading on the U.S. and Canadian exchanges. While you may hear about the same companies over and over again, some of the biggest trading opportunities can come from "no-name" stocks.
See which stocks (some you may never have heard of) made it onto today's 50 top stocks ranked by their technical trend.
The upside trigger remains the same in the $1876 area. The price is almost in the middle between the updated downside target and the bullish trigger.
Patience is the key to success. The confirmation will save you from unnecessary risk.
It is silver’s turn now.
The silver price is going accurately according to the plan, although most of you did not support it.
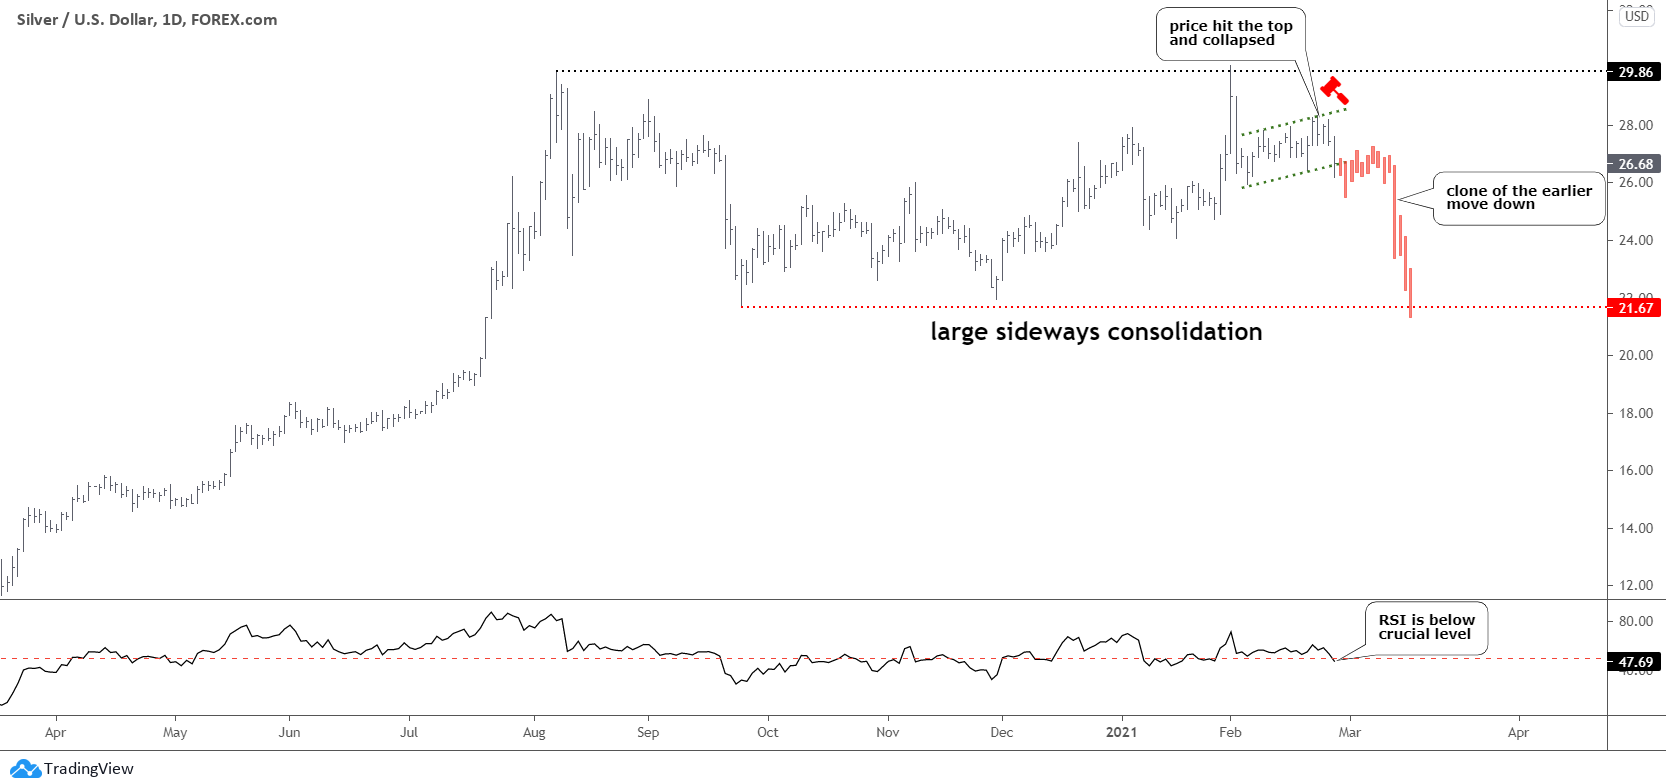
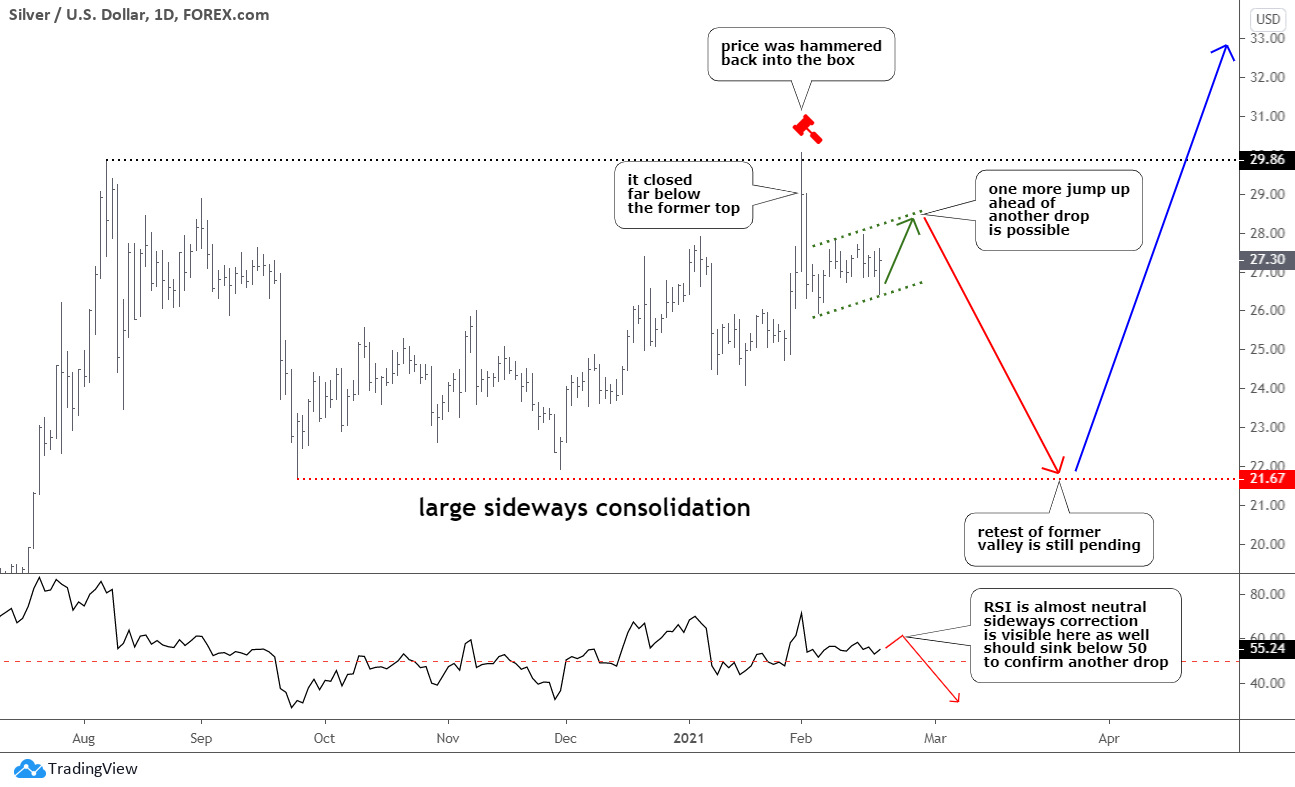
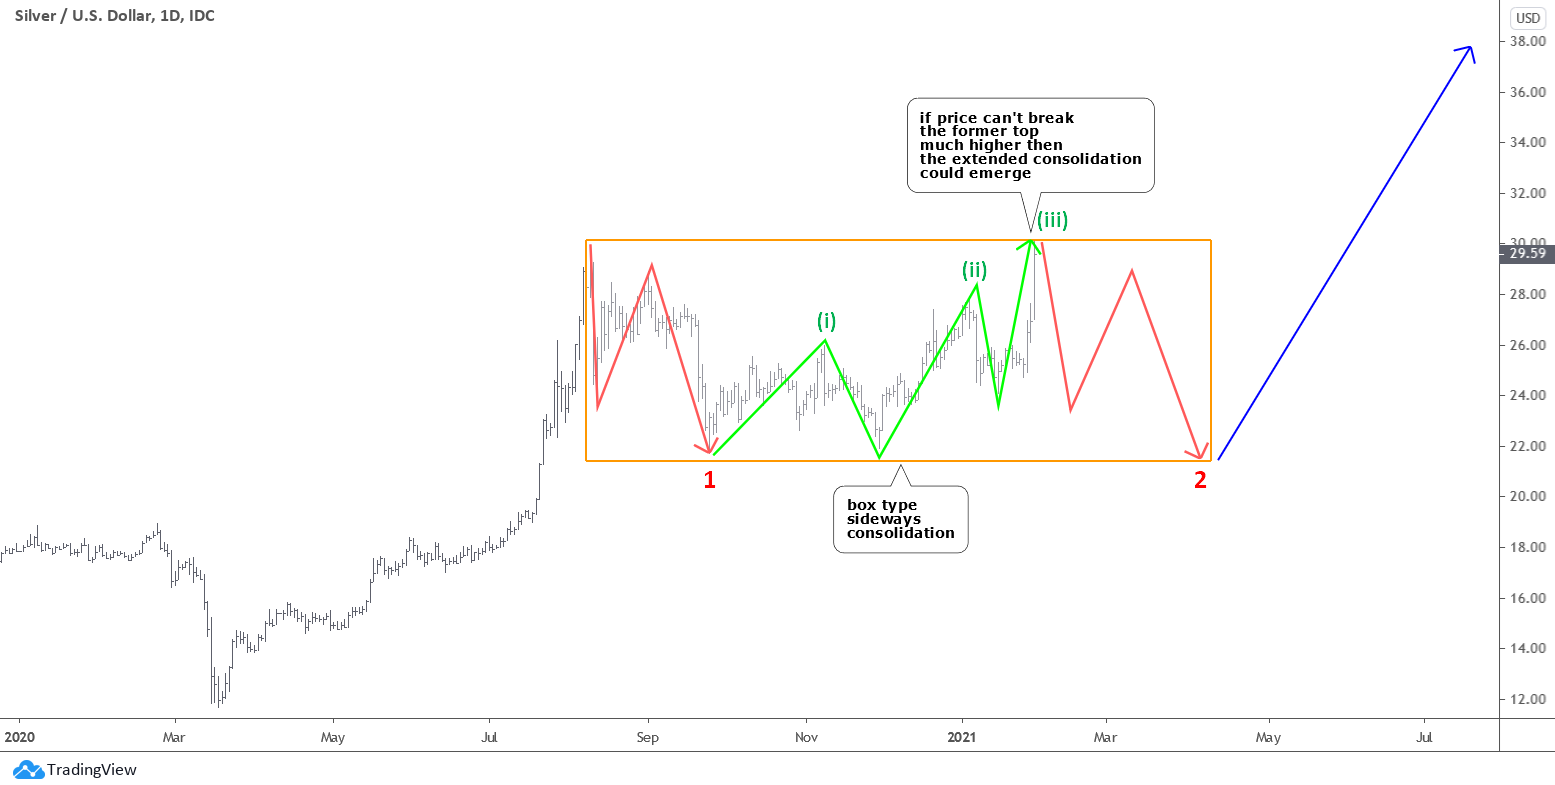
The price has hit the top of the green channel and then collapsed. It broke below the previous low as it fell out of the channel. We can see a small consolidation coming, as it is shown in the red clone. After that, the price could drop sharply to retest the long-awaited target of $21.67. This should complete the entire structure of the large sideways consolidation then.
The RSI went below the crucial 50 level as it was predicted earlier. There is enough room for the silver to hit the bottom of the “Box” before reading the indicator becomes extremely oversold.
Intelligent trades!
Aibek Burabayev
INO.com Contributor, Metals
Disclosure: This contributor has no positions in any stocks mentioned in this article. This article is the opinion of the contributor themselves. The above is a matter of opinion provided for general information purposes only and is not intended as investment advice. This contributor is not receiving compensation (other than from INO.com) for their opinion.
In 1974 the price of IKG of Gold was equal to more or less 1000 $ and to day around 60.000$ the question is not if the price will come down or not on the long term it will fluctuate + 10 % or - 20% never mind in the longer term it will move up Safety security easy to carry and to be sold
Its my view