
Last Thursday, the dollar rallied, reaching a two-month high versus major currencies, a day after U.S. Federal Reserve shocked markets by projecting a hike in interest rates and an earlier end to emergency bond-buying.
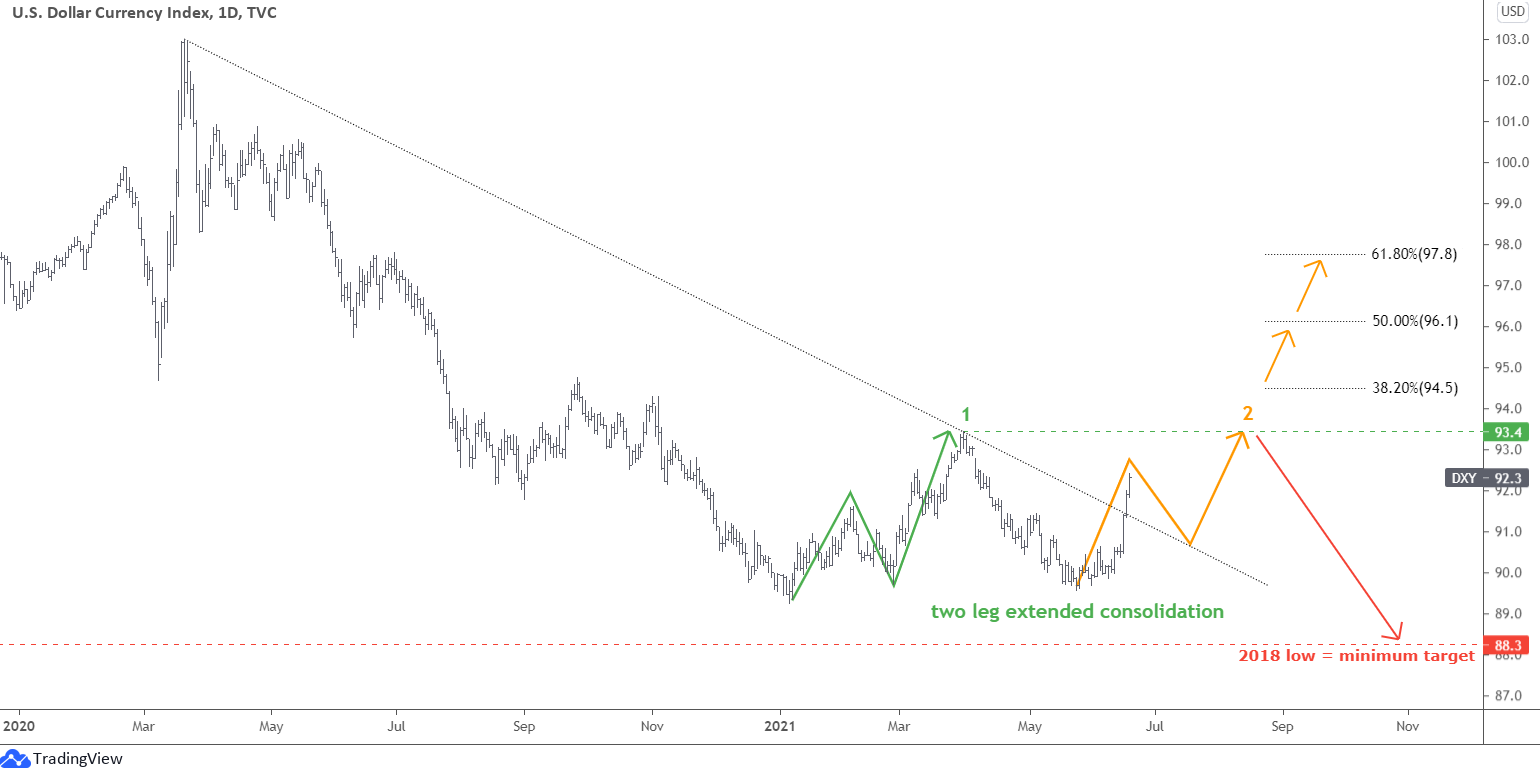
The price broke above the black dotted trendline resistance, which does not look like a minor correction. Instead, I think this is an extension of a large retracement of the entire move down that started in March of 2020.
The market could build the second leg of this large consolidation marked with an orange color. I highlighted the last leg with a green zigzag to the upside. The current leg up could repeat the same two-movement structure, so I built the orange zigzag. The first move within a second leg up could be over. I expect the upcoming pullback to retest the broken trendline resistance. After that, the retracement could resume and hit the top of the first leg at 93.4.
The second leg could stretch higher, so I added the normal Fibonacci retracement levels between 38.2% (94.5) and 61.8% (97.8).
Eventually, this large consolidation would end, and the price could retest the low of 2018 at 88.3. Therefore, I drew a new downtrend channel through the top of the current leg 2 when it peaks to calibrate the downward target then.
The surprising move of the dollar has changed the maps across the markets, including precious metals, of course. We cannot ignore the changed structure in the DXY chart; therefore, I updated both gold and silver charts accordingly.
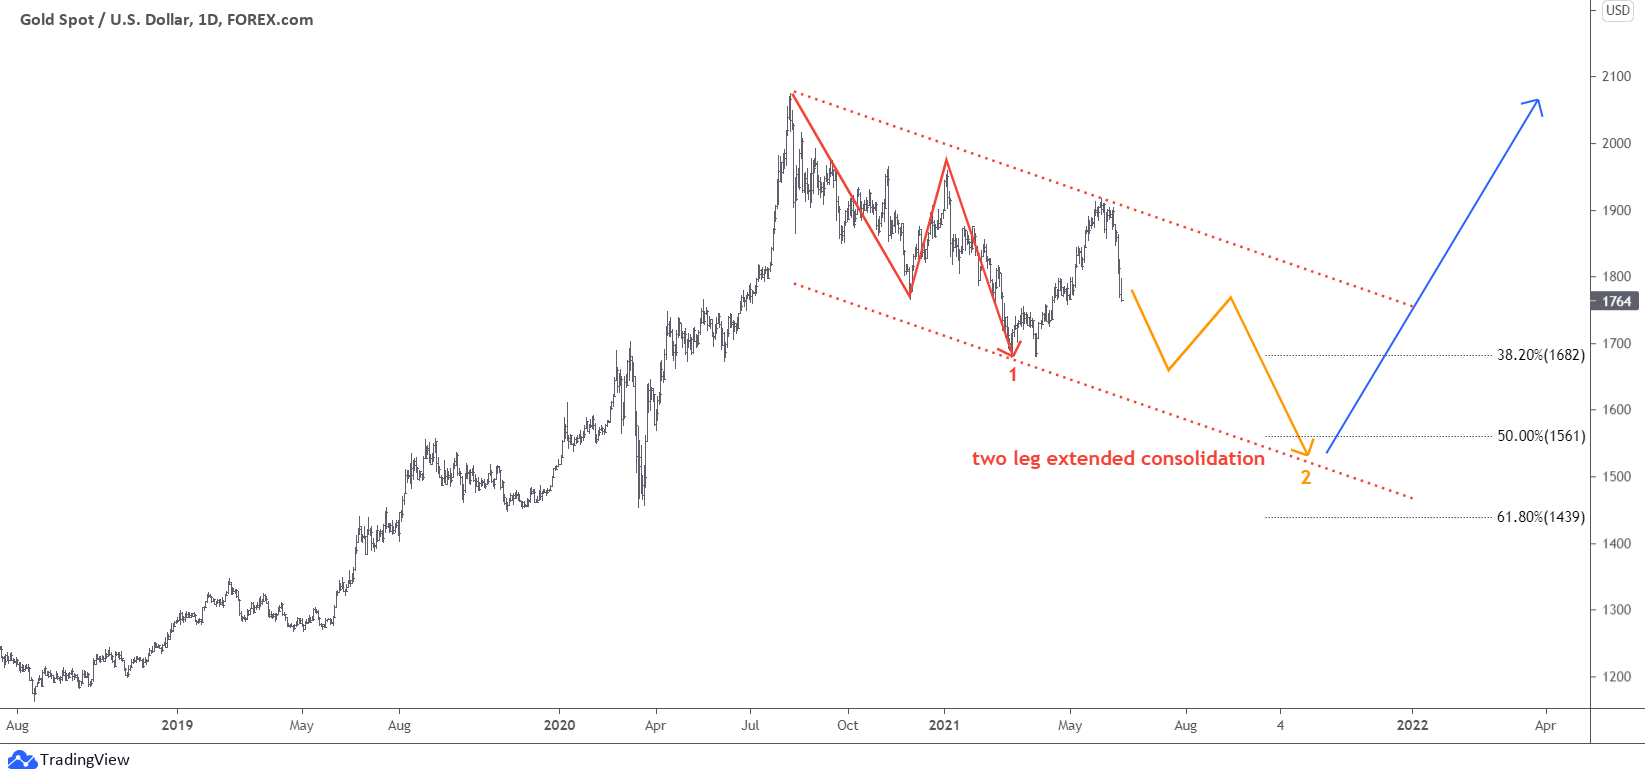
I consider the rally of the gold price preceding the recent crash as the joint between large legs down. The first red leg down was excessively complicated as it gave false hopes amid sharp spikes as it eventually collapsed lower. The same situation repeated during the promising move to the upside within the joint. In both cases, the price could not overcome the earlier top, so all these spikes fit the structure of extended consolidation.
How I Generated a 738% ROI Using This Secret Strategy
I used a version of this exact strategy to win the 2019 U.S. Investing Championship and have been teaching it to my students for a decade.
The second orange leg down could be more straightforward within the zigzag down. Usually, it fits the downtrend channel (red). The touchpoint is located in the area of 50% Fibonacci retracement level below $1561. The 38.2% level is located around the valley of the first leg down at $1682. The deep 61.8% level is located beneath the downside of the channel at $1439.
This extended consolidation could take some time to emerge as we would enter the fall season then. However, the Santa Claus Rally could be on time. The all-time high at $2075 is still the minimum target.
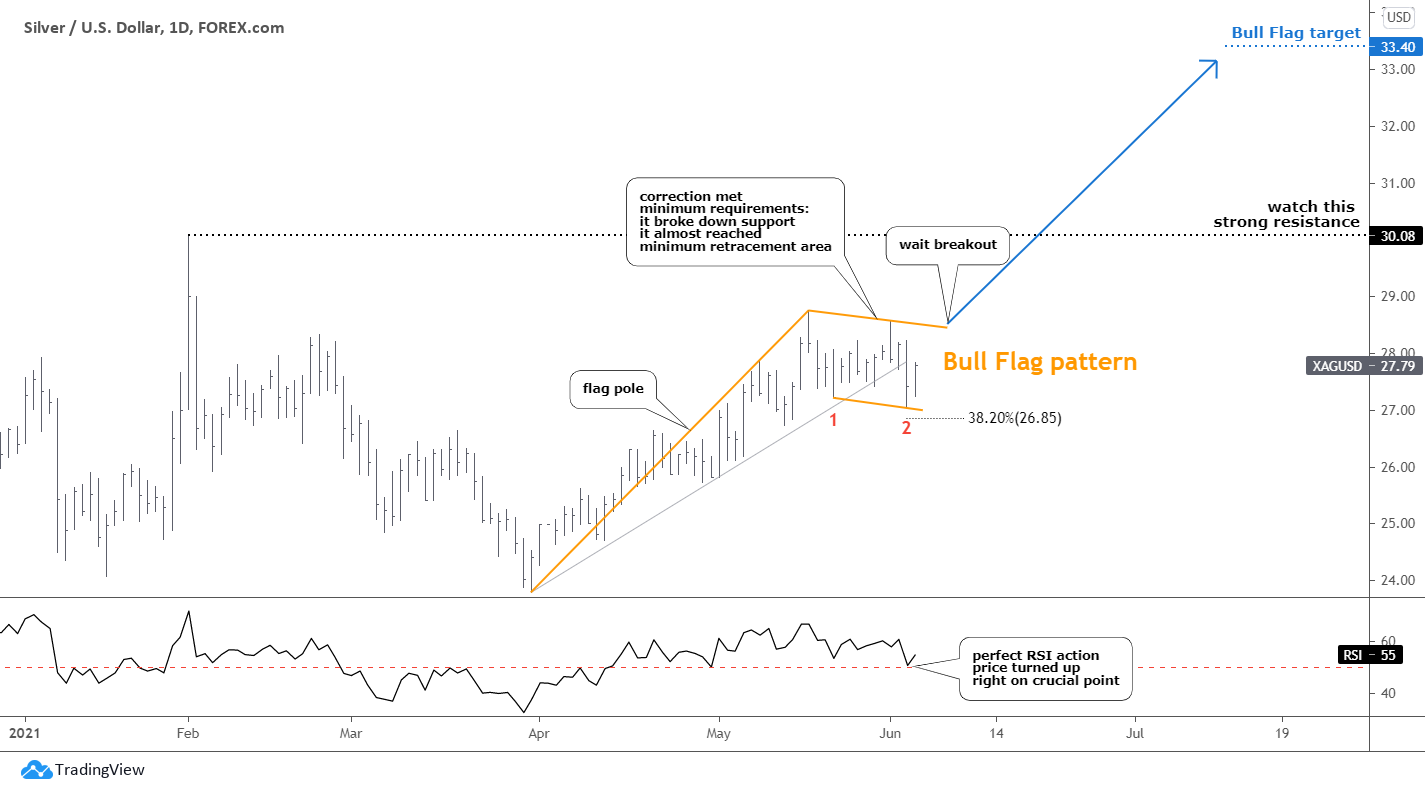
Silver was within a promising Bull Flag pattern. However, it could not break above the trigger, and then it failed to survive the rally in the dollar, falling below the flag’s downside. The pattern was invalidated.
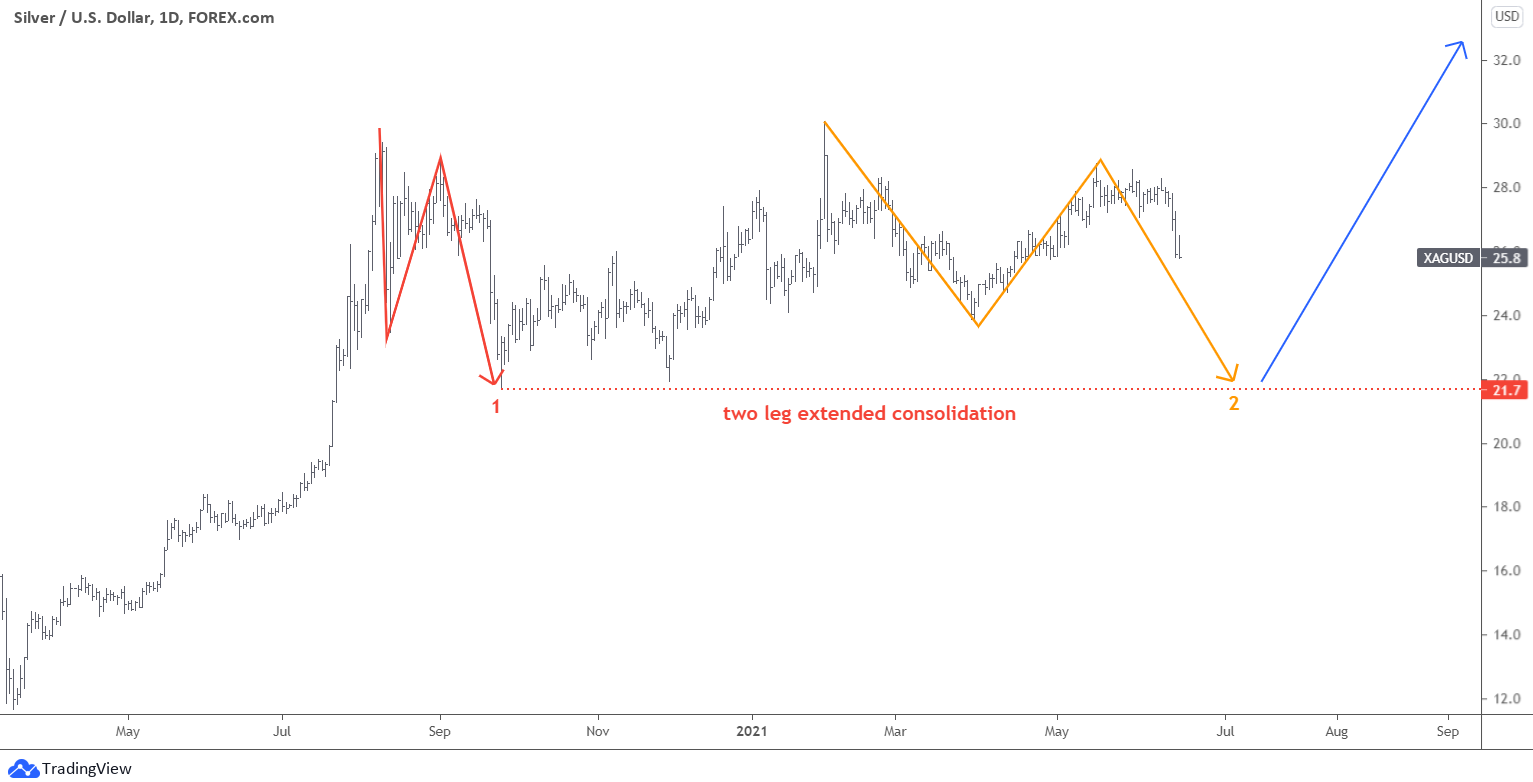
It looks like we are still in that large box-type consolidation. The first red leg down was sharp; the following joint was tricky as it broke above the top and quickly dropped back down.
The current leg down is slow, but the structure is similar, as the counter-trend did not overcome the top. The horizontal type of consolidation means that the second leg down should retest the valley of the first leg at $21.7. It is a big loss for the silver price of 16% from last Friday’s close.
After that, we could come back to recalculate the bullish target. The minimum aim is the $30 level in the area of the former top.
This summer could be long, so be careful.
Intelligent trades!
Aibek Burabayev
INO.com Contributor, Metals
Disclosure: This contributor has no positions in any stocks mentioned in this article. This article is the opinion of the contributor themselves. The above is a matter of opinion provided for general information purposes only and is not intended as investment advice. This contributor is not receiving compensation (other than from INO.com) for their opinion.