
One of our regular readers kindly requested the update of Platinum chart. Here we go as promised.
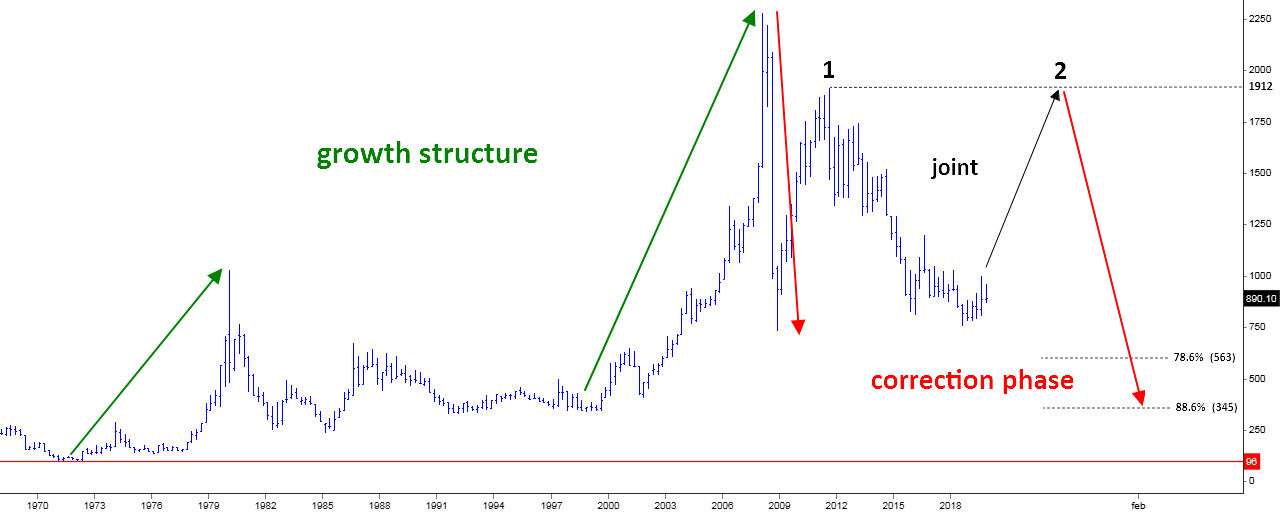
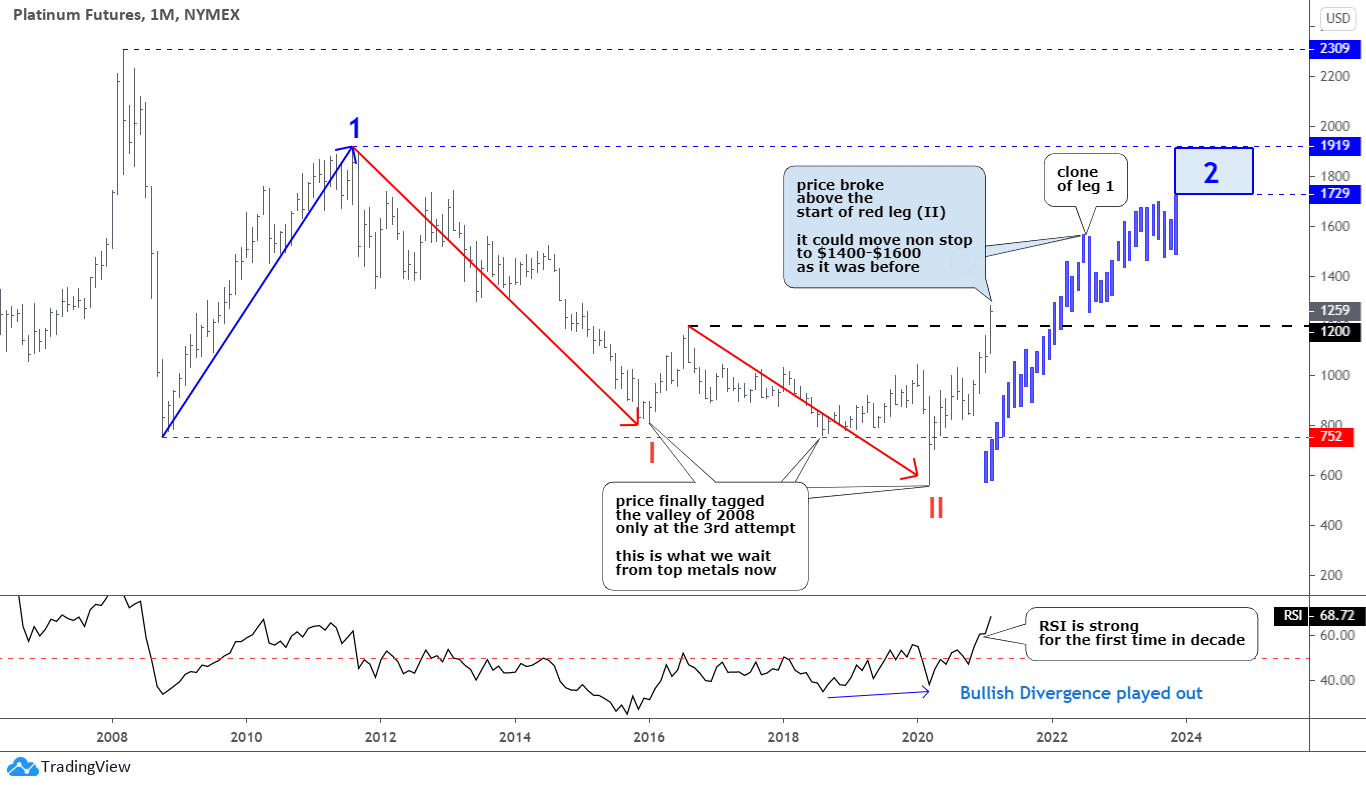
The global outlook for platinum posted in 2019 remains unchanged and you could see that big chart at this link. The previous update was this February as I used the cloning technique to visualize the current second leg up. Platinum futures prices did not follow it, therefore, below is the updated chart.
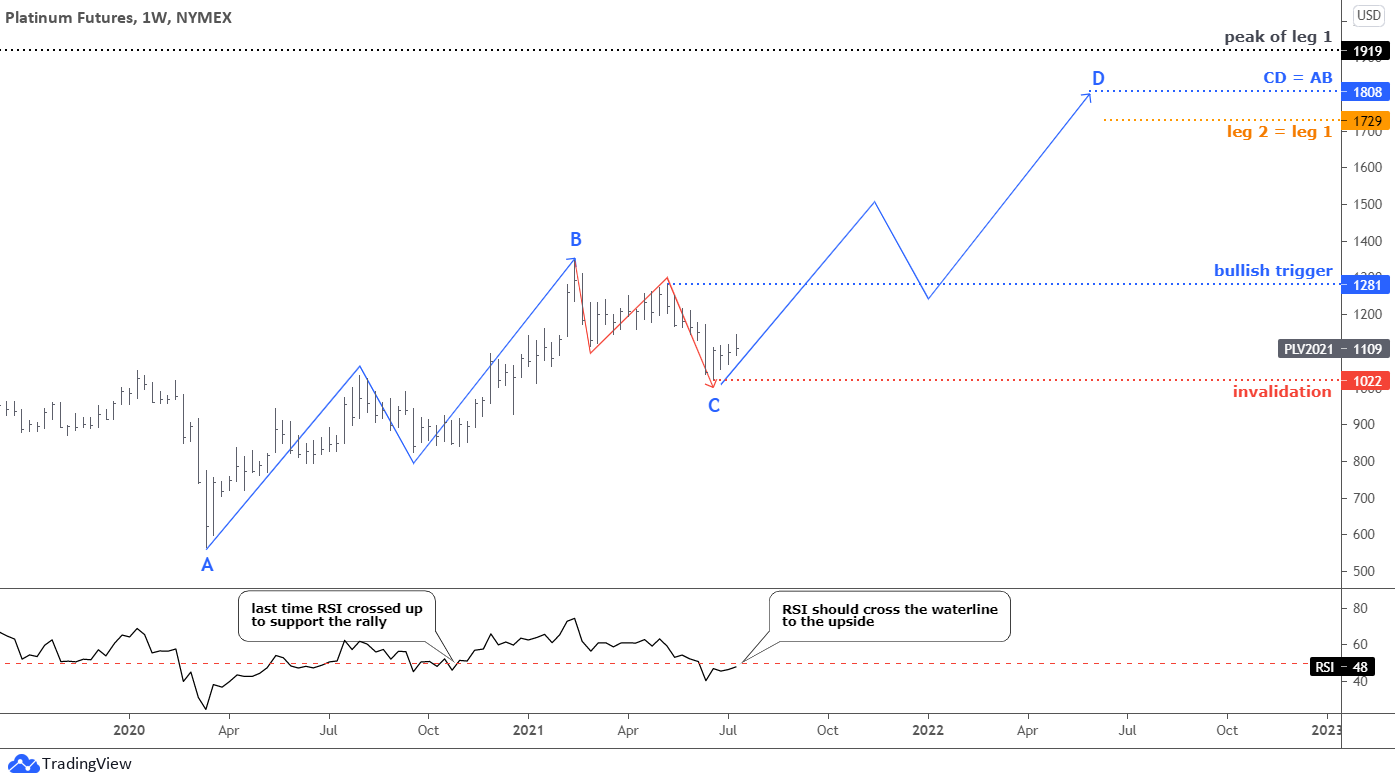
The leg 2 up had started with a two-leg zigzag up labeled as a blue AB part. It looks symmetric as both legs are almost equal and have the same trajectory. Then we can clearly distinguish the BC consolidation part, which consists of two legs down (red zigzag). It pierced the 38.2% Fibonacci retracement level to hit the valley of $1022. The RSI dropped slightly below the crucial 50 level.
Both AB and BC parts look like textbook samples of how the market moves. Now, platinum moves to the upside as the price overcame the $1100 handle. I added the zigzag of the AB part to the C point to show you the possible path within the CD part. The price should break up the bullish trigger set at the start of minor leg 2 of the last drop at $1281.
The target for the CD part is located at $1808, where both parts would be equal. The possible gain is 63% from the current level. It hits almost in the middle between the orange mark of leg 2 = leg 1 and the black peak of leg 1. Let us see which target the market would choose.
The invalidation trigger for this setup is located below the most recent valley of $1022.
Last time when the market was in the minor correction inside the AB part, the RSI just pierced the crucial 50 level and then turned to the upside to support the second leg up. We are witnessing the same situation as the indicator hovers around the “waterline” amid the consolidation. Thus, the RSI should cross the barrier to the upside to empower the new rally again.
Let us check the market balance in the table below.
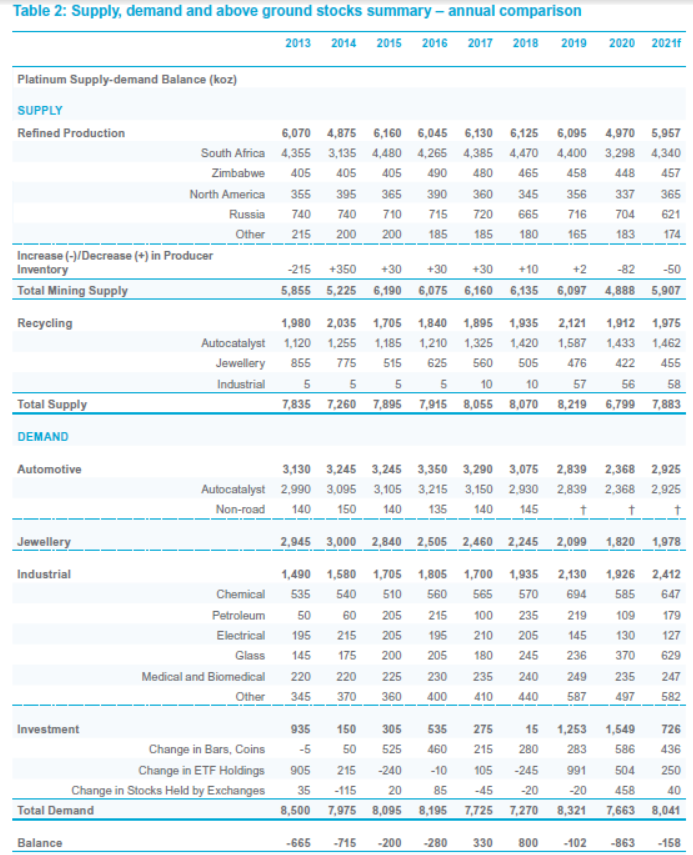
Source: Metals Focus, SFA Oxford via platinuminvestment.com
The projected deficit in the market shrinks to the level of 2019 at -158 thousand ounces. As a result, the market is thought to be more balanced than the last year when there was a huge shortage of 863 thousand ounces, which led to the rally of the platinum price.
The main driver of the deficit last year was the supply drop from South Africa for more than 1 million ounces. This year the forecast is optimistic about the recovery of the supply of the mentioned region. However, the recent period of instability in South Africa could question the projection shown above.
I spotted the possible game-changing pattern in the silver chart, and I would like to share it with you.
You could have noticed recently that the ongoing strength of the US dollar (DXY) did not ruin the precious metals as much as I anticipated amid the strong opposite correlation that we were witnessing last month. The thing is that if we check the current reading of the correlation coefficient, it shows a surprisingly positive correlation between silver and DXY at +0.22 on the daily basis. Admittedly, it is not a strong correlation; however, it is much higher than the regular negative correlation streaming to absolute at minus one.
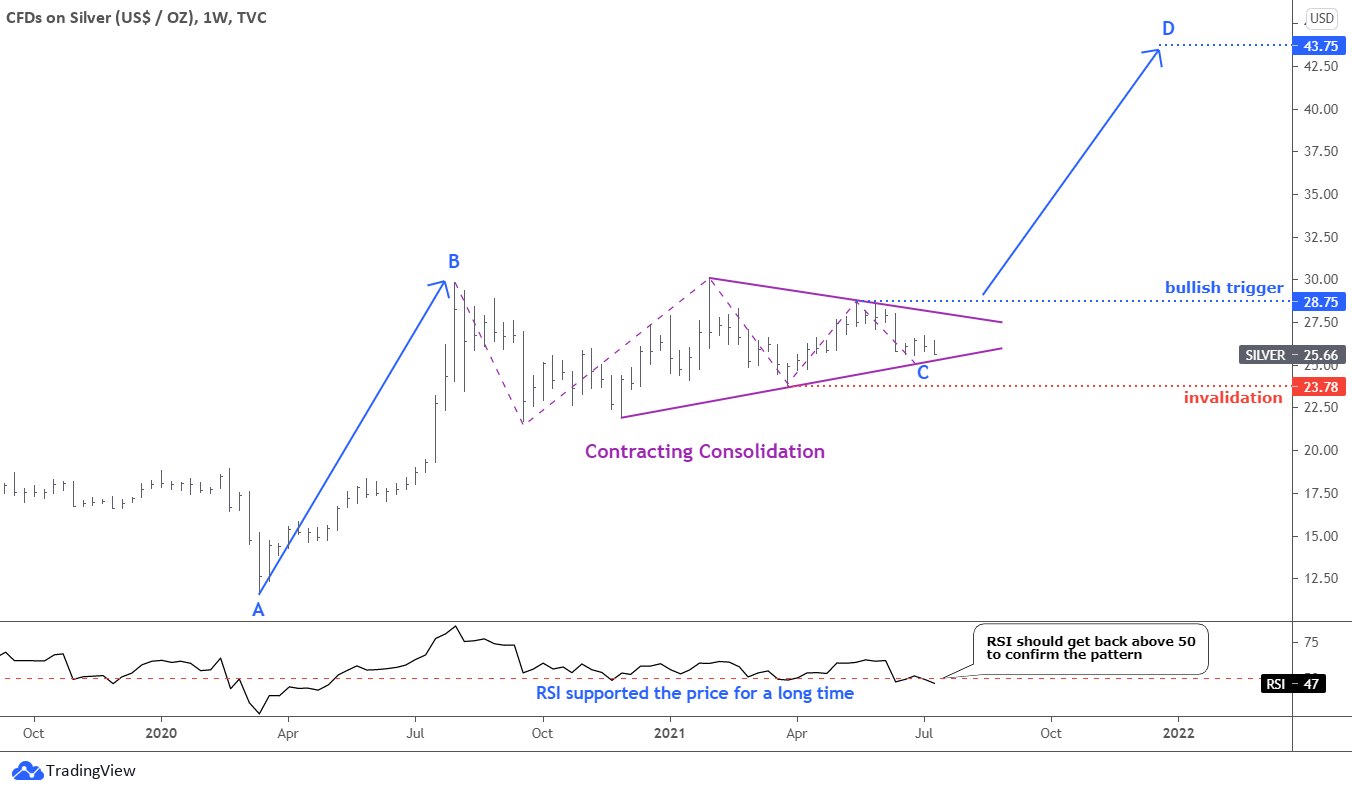
Thus, there could be a chance of earlier completion of the setback in precious metals. I spotted the pattern that could support that idea in the weekly silver chart above. We can see that the ongoing consolidation loses the volatility that we saw at the start. The size of legs within a purple five-leg zigzag gets shorter and smaller over time.
This could mean that we have a Contracting Consolidation. This is a result of fading selling pressure in the market. You could see on the RSI sub-chart that the indicator’s reading did not drop much below the crucial 50 level during the entire consolidation.
This could cheer up silver bulls and “HODLers” as we can consider a bullish continuation setup now. The upside trigger is set at the former peak of $28.75. The invalidation comes below the March valley of $23.78. The potential C point sits at $25.53 until the price is above that mark. The target is located at the ambitious $43.75 level where the CD is equal to the AB part. The potential gain is 70% from the current level.
The RSI should push back above 50 level to confirm the bullish setup.
Last month silver bugs outweighed bears on the poll.
Intelligent trades!
Aibek Burabayev
INO.com Contributor, Metals
Disclosure: This contributor has no positions in any stocks mentioned in this article. This article is the opinion of the contributor themselves. The above is a matter of opinion provided for general information purposes only and is not intended as investment advice. This contributor is not receiving compensation (other than from INO.com) for their opinion.