
It is not clickbait for hype. I will take you through my observations in this post to show you why it could play out.
Every market has its stages develop over time: Boom and Bust, Growth and Correction, Collapse and Consolidation. The corrective phase could be around for the stock market.
The main question, as always, is how deep it could drop when a retracement unfolds. This is not an easy one. To see the market from different angles, I built the comparison chart as I put the S&P 500 index itself (black bars), then I added Vanguard Value Index Fund ETF (VTV) (red line) and Vanguard Growth Index Fund ETF (VUG) (blue line).
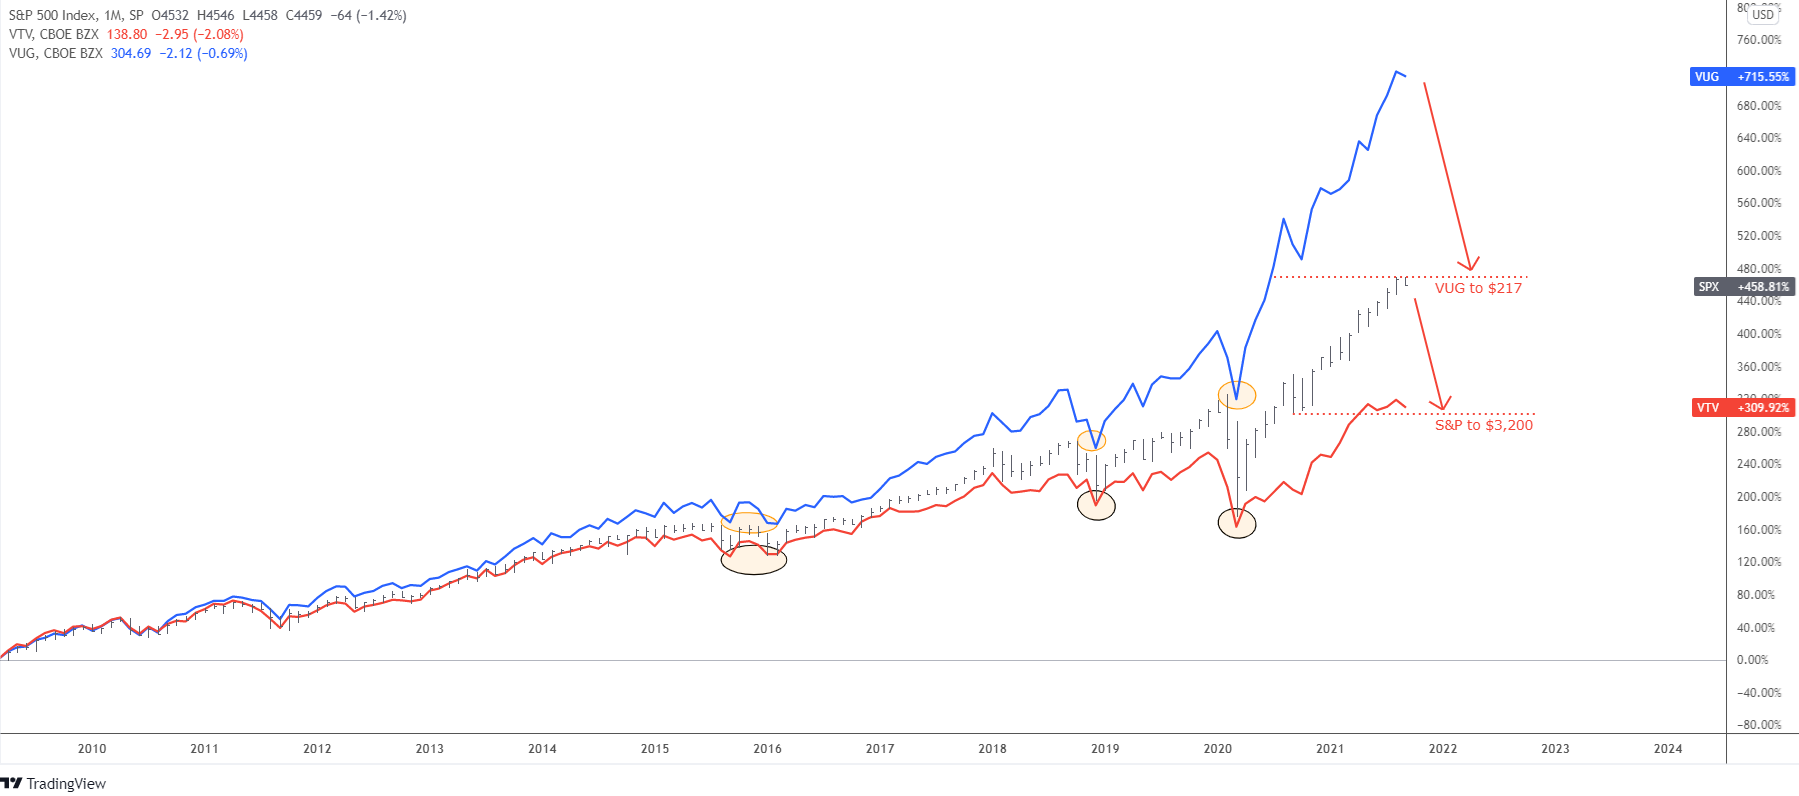
This monthly chart starts from the major bottom in 2009. SINCE THEN, the S&P 500 index has gained more than 450% since then, the value stocks have scored more than 300%, while the growth stocks have made a jaw-dropping 715%.
I think many of you already have noticed that value stocks are not contributing much to the recent growth of the S&P 500 index since May. The red line graph of VTV looks like it has reached some sort of ceiling as the trend turned flat, and it is even nodding now. This could be the first harbinger of possible upcoming correction.
The second alert comes from the VUG as value stocks soared too high too fast over the broad index. The gap extended too much even given the sharp angle of growth in the S&P 500 index itself. The graph looks like a picture of some large animal like a Sea Crocodile, who opens jaws widely. Eventually, the crocodile will close his mouth.
Let us address the main question as we are done with alerts.
The observation of the VTV price behavior shows that it usually acts as baseline support for the broad index. The latter has been finding the valley most of the time catching with the bottom of VTV. I marked such contact areas with red ellipses.
We cannot precisely forecast the depth of the VTV collapse; however, we can see the minimum area where the S&P 500 index would close the gap with the growth stocks ETF. It is located at the recent top of VTV, which corresponds to $3,200 in S&P 500. This is also the previous consolidation area. The broad index should drop almost 30% to reach that level. In 2020, the market collapsed 35%, so it does not look impossible.
Growth stocks act precisely as their name in the shown period. The blue line has flown above the rest since the summer of 2010. Moreover, it accelerates during the strength of the market, extending the positive gap over time.
Let us see how it acts when it is raining. I spotted the three most visible areas with orange ellipses for visualization. During collapses, the VUG’s blue line reaches the most recent top of the S&P 500 index with a time lag as the market rarely drops like a rock.
This observation implies that the VUG could drop to $217, where the current top of the broad index corresponds with the growth stock ETF price. This is the valley of the previous consolidation that emerged in 2020. Here again, we see almost a 30% collapse as we projected for the S&P 500.
Intelligent trades!
Aibek Burabayev
INO.com Contributor, Metals
Disclosure: This contributor has no positions in any stocks mentioned in this article. This article is the opinion of the contributor themselves. The above is a matter of opinion provided for general information purposes only and is not intended as investment advice. This contributor is not receiving compensation (other than from INO.com) for their opinion.
Black%Swan
Collapse of the US $ below 89.5.
If we keep reading articles that predict this kind of drop, then it will surely happen!
If you're in growth stocks, you're saying "Things are perfect, how can they get better?"
If you are not in growth stocks, the question is "Why ain't I in growth stocks"