Bulls or Bears - Who Will Win?

Hello traders everywhere! Adam Hewison here, President of INO.com and co-creator of MarketClub, with your video update for Tuesday, the 11th of March.
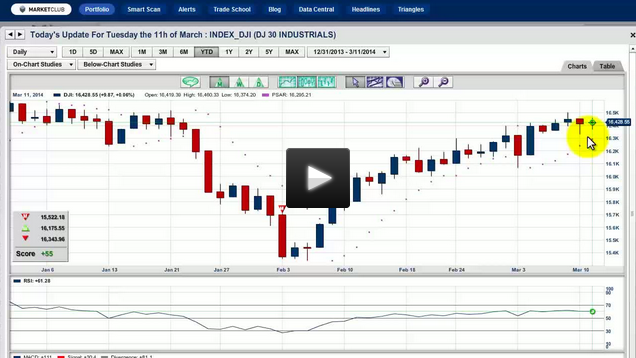
The Dow Is Balanced

Looking at the Dow Jones Industrial Average (INDEX:DJI), you have half of the stocks in a bull trend and the other half in a bear trend, giving a very mixed picture and somewhat neutral look to the Dow 30. The question is, which side is going to win out, the bulls or the bears? As with any market, I will be watching the Trade Triangles for an indication of this index's next move.

Gold Adjusting To New Levels

After rallying over $150 from the lows that were seen in late December, the gold market has gone into a sideways pattern as it begins to readjust to its new trading levels of $1,320 to $1,360. At the moment, it would look like short-term traders should be out of this market and that long-term traders could hold on to long gold positions. I'm still see the Gold (FOREX:XAUUSDO) moving higher longer-term. Continue reading "Bulls or Bears - Who Will Win?"

Chart of The Week - Natural Gas

Each Week Longleaftrading.com will be providing us a chart of the week as analyzed by a member of their team. We hope that you enjoy and learn from this new feature.

This week’s focus turns to the May 2014 Natural Gas futures (NYMEX:NG.K14.E), where the transition into spring seasonality and warmer weather has weighed down demand outlook. Over the winter months, we had continually seen larger than expected draws from Natural Gas supplies due to extreme winter conditions, but as US weather forecasts continue toward warmer levels, it appears the threat to already tight near-term supplies is diminishing.

Since reaching a high print of 4.893 a few weeks ago on February 24, 2014, May Natural Gas has taken a slight leg lower and consolidated over the past few weeks as it decides where it will head next. The Commitments of Traders report as of March 4th has shown traders have gone from a net long to a net short position on Natural Gas, which hints that the recent strong up-trend may be losing steam. In the near-term, I would agree with this negative bias, and look for a correction in the Natural Gas market.

For a swing trade, I would be a seller as the market moves below Friday’s low of 4.530. My near-term target would be the swing low of 4.393. This position would allow you to use the 20 day moving average as a resistance point, as this indicator has kept the market in check during the recent consolidation period. Continue reading "Chart of The Week - Natural Gas"

Key Week For Stocks

This past weekend was an interesting one as it marked the five year anniversary of the bull trend for the stock market here in the US. Looking back on March 9, 2009, we've come a long way on the upside. According to the popular ETF SPY (PACF:SPY), we are up over 181% from the bear market low.

Over in China this weekend, their stock market collapsed to a five year low because of poor demand for their exports. So, on one side of the ledger you have the US market making new highs and in China we are witnessing their market make five year lows.

Can we see these two trends continue? Can the US continue going higher after five years? Is the economy so bad in China that it means that their exports will drop off even more than the recent decline of 18%? Being their number one trading partner, we put ourselves in a bind. If we can't sell the imported goods, then it would appear our economy really isn't that great either.

Seldom do you see such dichotomies in economic trends between two powerhouse economies. Something has to give.

Last week I talked about the US market reaching a tipping point, you can read that post here. What I did not mention is that margin debt, or the money investors borrow from their brokers for stock trading, has reached a new all-time high. This normally indicates that an excessive amount of speculation is going into stocks, especially low-priced stocks. Could this be a warning sign of what's ahead? Continue reading "Key Week For Stocks"

Do you know how your trading is taxed?

By: Traders Accounting

Traders spend a lot of time and money learning their trade. They take courses to learn how to make money in the market and realize their dreams of working for themselves. While traders try to learn about every aspect of their trading strategies they often overlook one important area. This frequently overlooked area is one which can cost a trader a significant amount of their hard earned profits.  If you have not guessed it yet we are referring to taxes. Many traders don’t fully understand how their trading activities will be taxed until they have received their tax bill and it is too late. This article will supplement your trading education by explaining the tax treatment of many commonly traded instruments.

Stocks, Stock Options, Exchange Traded Funds (ETFs), and Options on ETFs: Continue reading "Do you know how your trading is taxed?"

The Crisis in Ukraine: What's Next?

Social mood is another term for the shared inclination of a society. The conflict between Russia and Ukraine is a dramatic example of social mood in action.

By Elliott Wave International

Editor's note: You'll find a text version of this article below the video.

For 3 years, Russia's stock market has been drifting lower. Here is why that's important.

The stock market shows the mood of society.

And social mood drives social actions -- like public protests and even war.

That means that if you follow the stock market, you'll know what kinds of events are likely to happen in any country. Continue reading "The Crisis in Ukraine: What's Next?"