
WATCH THIS SPACE
Check here on Tuesday the 2nd of September for contest details
Check here on Tuesday the 2nd of September for contest details
Today I'd like to welcome back Gary from Biiwii.com. I've asked Gary to teach us a bit on divergence.
=============================================================
I want to have a look at divergence by the lower panel indicators and the valuable clues they can provide when used in conjunction with price activity, support/resistance levels and of course fundamentals of a given stock, commodity or other asset.
Divergence can be used to help define bullish or bearish setups. With my M.O. as a 'bottom feeder', today I will focus on a chart that sports most of the components I like to see when setting up for a swing trade; it is the etf UNG (the United States Natural Gas Fund) which has been declining relentlessly from a manic high in June and mercilessly punishing anyone innocent enough to buy into this mini-bubble under the incorrect assumption that it was 'commodities to da moon'. But as "what goes up comes down" so too does the reverse eventually assert itself.
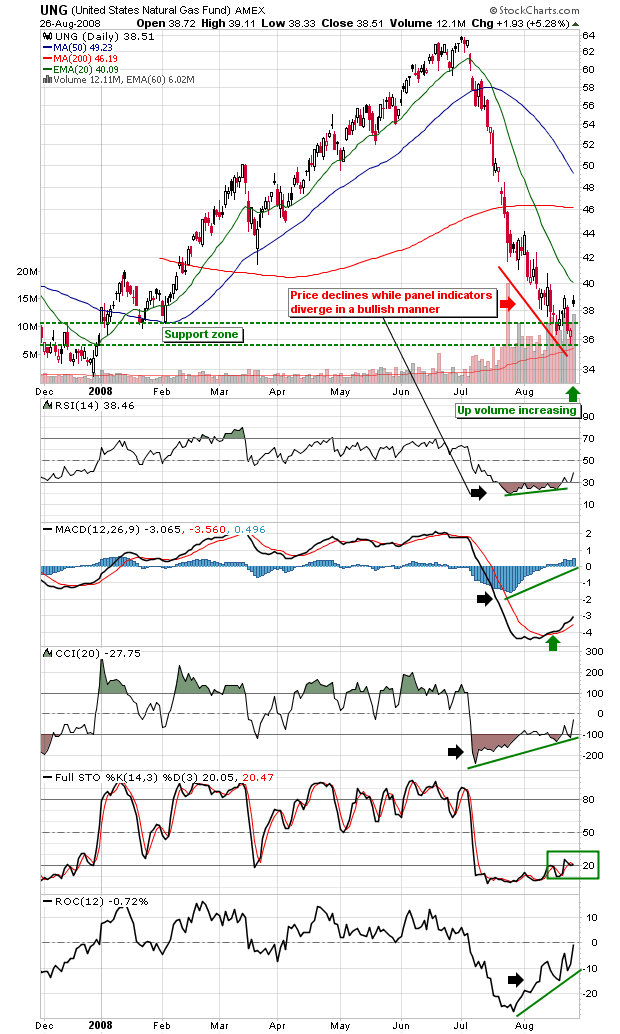
In looking at NatGas, I like the fundamentals much better from a seasonality and value perspective (thanks to a 40% decline) if only for a swing trade into the fall or winter. Fundamentals are the first priority. Check. Next, the decline has brought the price down to a notable area of lateral support. A decline like this is simply not going to be arrested until support can be defined. Check, we are at noticeable support.
Finally, what I like to see in a bottom feed is relentless and and dispiriting price action down to said support with bullish divergence by the indicators. We have that in spades with RSI, MACD, CCI and Rate of Change all nicely divergent even as bubble participants give up the ship (fresh lows in price). Right at support. I have included the full Stochcastics which have also diverged but more importantly are on the verge of 'triggering' above 20. That would be another important cross reference to a bullish case.
So there you have it. A simple bottom feed amid terrible price action down to support and bullish divergence. Nothing but NOTHING in this market is 100% and it is all about risk vs. reward. This trade in my opinion has a good risk profile. The risk is certainly better for Natty than back in July, wouldn't you say? I have my own money in this trade and speaking of risk, if the noted support fails so too will the trade and I will book a loss. It won't be the first time. But the key is to always understand your risk profiles and control same.
Edit (10:00) At the time this post was written (pre-market 8/27/08) I was expecting UNG and NatGas to continue hammering out a painful bottom (those are the best kind for sustainability). But during normal market hours we appear to be getting quite excited and gappy. If UNG registers a manic over bought condition directly off of the low I am going to sell it. Please use the above as a chart study on indicator divergence only.
For today's guest blog post I've contacted one of my "go-to" silver guru's David Morgan from Silver-Investor. The silver bug bit David as a very young man and his thirst for and knowledge of silver has only grown over the years. I asked David to give us some insight into why silver is money!
=================================================================
The Monetary Case for Silver (Silver Institute speech abbreviated)
Most of this research came from my friend and associate Mr. Franklin Sander’s Sanders of the Moneychanger (see www.the-moneychanger.com).
The surest way today to be laughed off the podium and out of any economics department is to declare that silver is money, and money vitally necessary to our economic survival. I should know recently a rather significant “silver” event took place in Spokane and some very notable people attended this affair including Jeff Christian from the CPM Group, The Commodities Futures Trading Commission, The Silver Users Association, and several producing silver companies along with a host of silver exploration companies. Mr. Phil Baker CEO of Hecla Mining gave the Silver Institute’s presentation due to Michael DiRenzo’s unavailability.
I was asked to do an outlook for silver and my presentation was mainly about the fundamental case for silver with some thoughts given to the possible fate of the U.S. dollar. I was the only one that even mentioned the current state of economic affairs from both a current and historic point of view. Following my presentation a listener that seemed very shaken quickly approached me. He blurted out you are NOT going to speak about silver, as money? I thought the question to be rather odd, because obviously I had not.
This dislike for any mention of silver in the monetary system has been that way since the end of the bimetallic discussion in 1873 (in the US), but not because the monometallic gold standard advocates, or inflationary fiat money advocates, had better arguments. They just bought more effective politicians.
I will prove, from logic and experience, that not only is silver money, but no sound money system is possible without it. This of course is a very tall order and perhaps it would be better said that I will present the case and you decide.
In fact, research history and you will never find any trouble with bimetallism whatever. In a true free market system where both gold and silver are not set at a government dictated ratio but the market itself determines the correct ratio we have ample evidence this method works best. The market always quickly and successfully adjusted to changes in the ratio over a range of 2.5:1 to 16:1 -- UNTIL governments began to fix official mint ratios, late in the Middle Ages.
Allegedly, bimetallism broke down under the stress of the 19th century. Let us examine if this is true?
The Arguments
Bimetallism caused too much fluctuation. This argument will be found in many texts dealing with precious metal money. However, the truth: The fluctuation over a 40-year period hardly amounted to 5% at greatest. Let us put that in context with today’s monetary system where currencies can swing 5% in a day.
So much new silver was discovered that price was driven down. This argument is one widely propagated by nearly every monetary textbook in existence. Again the truth is that the ratio was trending upward (silver becoming cheaper than gold) from about 1800 to about 1840), when new gold discoveries in America (California 1848) and Australia cheapened the value of gold relative to silver. Why? Because they flooded the market with gold. So if anything was a “problem” it was new gold discoveries not more available silver.
Is there a problem with a state mandated bimetallism? Yes, because this displaces the free market altogether. Rather than learn from 4500 years of human experience and use this experiential knowledge, the state knew better and fixed the gold/silver ratio. The out is predictable in fact it gave rise to what is known as Gresham's law: cheap money drives expensive money out of circulation. The silver became worth more as bullion than it was at its face value, so coinage was melted down and disappeared from circulation.
Unless the free market remains free to determine the gold/silver ratio, state mandated ratios would always be driving one or the other metal out of circulation. Therefore bimetallism with state mandated ratios but only with state mandated ratios will deflate the money supply, proportionate to new supplies coming to market.
The U.S. never was bimetallic, but always symmetallic. Founders were too smart for anything else. US Coinage Act of 1792 made the dollar of silver (371.25 fine grains of silver) the standard coin of the realm and legal monetary unit. It also provided for gold coins, eagles, half eagles, and quarter eagles of about 1/2, 1/4, and 1/8 ounce each, to be minted. These were VALUED IN but not DENOMINATED IN dollars of silver.
Therefore, whenever the ratio changing drove one or the other metal out of circulation, the content of the gold coins could be adjusted (raised or lowered) to accommodate changing market valuation. This exact thing happened in 1834, when the gold coin size was changed (reduced), yet without cheating anyone or changing the size of the standard silver coin, the dollar, at all.
The tidal wave of silver coming out of the Comstock Lode cheapened and destabilized the value of silver so the US had to abandon silver. Truth: HALF the value of the Comstock was realized from its gold production. (Silver Bonanza, p. 24, Alexander Del Mar, Monetary crimes, p. 90).
So let history be our guide, from the mists of time until the late 19th century, the bimetallic system served mankind without any major disruptions or instabilities. Compare that to the gold standard which lasted only about 50 years, from 1873 to 1914, or 1934, depending on which date you choose. Here you will have made academics like our good Professor point out problem after problem but it rests with a mono metal standard (gold) not silver although silver certainly gets blamed.
Premise: Bimetallism is necessary in a sound money system because it establishes an unchanging reciprocal standard.
In a bimetallic system, gold is valued in terms of silver, and silver in terms of gold. The standard for valuing both is OBJECTIVE. The free market is left alone to determine the correct ratio.
In a monometallic [gold] standard, gold is valued in terms of a fiat currency unit.
Therefore, a monometallic standard is already, in embryo, a fiat system, because no empirical valuation can be made for the fiat unit, which becomes the standard of value for gold.
Therefore, no sound monometallic money system can exist. Could this be a reason that mankind used it for so many millennia?
The test of any theory is simply does it work or does it not? How did bimetallism, with silver as the linchpin -- work versus fiat money or monometallism? Bimetallism worked well for 4500 years, adjusted to every stress, even as the ratio grew from 2.5 to 16. Alleged instability of the 19th century was determined to be; a result of state action smothering free market adjustment. For all practical purposes no instability at all was observed when compared to monometallism or fiat currency.
Compare this to the economic history of the late 19th and whole 20th century. The monometallic gold standard lasted only from 1873 until the first crisis appeared near the founding of the Federal Reserve or it could be argued at the worldwide abandonment of gold standard in Great Depression. Whichever end date you choose, it is substantially less than 4500 years. The only conclusion to be drawn from history and theory is that a sound money system without silver and bimetallism is impossible.
We have now arrived at what is probably the culminating monetary and economic crisis of the last 200 years. It is possible we will see the death of national fiat currencies. It is also possible now with gold and silver backed electronic currencies that all national Central Bank currencies could be replaced within 24 months, once the panic starts.
But enough of history and what may or may not happen. Let us explore the present time. I interviewed Mr. Hugo Salinas Price in The Morgan Report. Mr. Price wrote and article in mid December 2004 and brought the question of silver being brought back into the monetary system. This in my view is the most significant story about silver in the past decade, in fact far more important than the announcement by Warren Buffett in early 1998 that Berkshire Hathaway had purchased nearly 130 million ounces of silver.
It is an honor to be,
David Morgan
Today I've asked Tony from TheGrainTrader.com to talk a little about Fundamental VS Technical Analysis when it comes to the grains...and trader in general! Enjoy!
==================================================================
I have always been a faithful user of technical analysis as my choice of ways to predict market direction, and I have had much better success with it as compared to what I have had with fundamental analysis.
Technical analysis lets me use a price chart to compare the past and present markets to find profitable trends and patterns, which brings me to one exception that I do use at times.
Although I don’t put much faith in crop reports, hard freezes, or droughts, I have had some use for seasonal patterns in the grain markets, and I like them, because I can identify them on a price chart.
Now, a tendency is just that, a tendency. Not all seasonal patterns are consistent enough to trade on, so you have to be careful to only use them as a guide and not as a fact. You must verify them with technical analysis before you actually make a trade. Don’t make a trade based solely on the seasonal tendency, or you probably won’t have much success!
Seasonal data can be found many places, but the best tendencies to use are the ones you can validate for yourself, on a chart. One of the best tendencies, I have identified, is for Oat futures to bottom around July and August, and then rise into December. (That’s just a little tip!)
Just remember to verify seasonal patterns with technical analysis, and always keep your stops placed! Good luck with your trading.
Tony Lorenzo
Today I'd like everyone to welcome Lance Beggs from Your Trading Coach.com. Over the past few months I've gotten to know Lance, his site, and his teachings. Overall I'd say he ranks up there with Adam when it comes to his genuine desire to help traders. I've asked him to come and teach us a little about price analysis. Enjoy!
================================================================
Hi MarketClub traders,
Many thanks to Trader's Blog and Adam for the invitation to write today’s Guest Blogger entry.
One of the key features in my analysis involves monitoring price action, in order to gain an insight into the short term sentiment of the market. Determining who is in control at that time – the bulls or the bears, and assessing how they’re likely to respond to changes in the market.
I thought today I’d prepare a quick article to give an overview of how I analyze price. Those of you who know me know that I’m a great fan of candlestick charting. However, price analysis is much more than just watching for your favorite candlestick patterns. Too many people just teach the candlestick patterns, which are fine, but in my opinion there’s some essential analysis missing that an astute trade needs to consider BEFORE they look at price action and respond to every candlestick or bar chart pattern. Let’s have a look at what I mean.
Price analysis for me is essentially a top down approach, working from the macro level of Market Structure (so we analyze the big picture first), then down to the current Trend within that structure, and only then do we look at the current price pattern, whether through candlestick analysis or whatever other method works for you.
So I basically start off with a wide view of the market, and drill down to the detail in the current price bar or pattern. I prefer to do this over two timeframes.
The market structure is defined primarily on a higher timeframe. For me, as a daytrader, that’s the one hour charts. Of course, if you trade differently to me then that can be any other time period you wish. Just make it higher than the timeframe you trade on – I recommend by at least a factor of four.
Then on the shorter timeframe (what I call the trading timeframe) I refine the market structure a little further, analyze the movement and strength of the trend, and then assess the bullish or bearish sentiment based on the current price patterns.
For me, the trading timeframe’s anywhere from 1 minute to 5 minute charts, depending on the market and its volatility, and how well the price is flowing.
So, what do I mean by market structure, trend analysis and price analysis?
Firstly Market Structure:
(a) The higher timeframe chart is opened and any areas of major support or resistance are identified and clearly marked on the chart.
(b) Support & Resistance for me are areas of past price congestion, swing highs or lows, or gaps. That doesn’t include any ‘guessing’ at future support or resistance, via the use of pivots points or Fibonacci levels. I’m not a fan of these analysis techniques. Of course, if they work for you, good on you, keep using them.
(c) My expectation when I trade is that there is a higher probability of price stalling or reversing at these areas of major support or resistance.
(d) I then narrow my focus to the shorter trading timeframe and add to the market structure framework, by identifying areas of minor support or resistance. (Typically we look on the current trend first, but you may at times need to look back beyond the current trend, to previous market action, to find applicable areas of minor support or resistance)
(e) Once again, these come from areas of congestion, swing highs or lows, or gaps. That is, areas which are proven to stall price movement or reverse price direction. My expectation with minor support or resistance is for a higher probability of minor support holding in an uptrend, and minor resistance holding in a downtrend.
That’s it for Market Structure – simply identifying a support and resistance framework within which price moves. Simple!
Having defined our market structure, or a framework within which price will move, we now focus our attention on the current trend. This occurs, as does all further analysis, on the trading timeframe.
(a) I conduct analysis on the trend to identify its strength. Is the trend moving strongly, in which case we can anticipate it being more likely to break through the next support or resistance levels, or is it weakening, in which case we have a greater probability of the support or resistance levels forming a barrier to further price movement?
(b) We determine the strength of the trend by looking at its proximity to the support and resistance barriers within the framework, and also gain clues from changes in momentum or volatility.
(c) Is the current price swing, faster or slower than preceding swings within that trend? Is the current price swing speeding up, or slowing down?
(d) Is the volatility changing? Is the average range of the price bars increasing or decreasing?
(e) These sorts of questions regarding changes of volatility and momentum can give you clues into the changing strength of the trend, and the likelihood of a reversal at, or continuation through, an area of support or resistance.
(f) If you want to get experienced at this, it takes time. Review price charts over and over, identifying how changes of momentum and volatility precede either a continuation or reversal of that trend.
Having gained an appreciation of the strength of the trend, and its location within the support and resistance framework, ONLY THEN, finally, do I concern myself with the current price action to determine the bullish or bearish sentiment (or more particularly a potential change of sentiment) through candlestick analysis.
What does this little bit of extra work give me?
Here are a couple of examples:
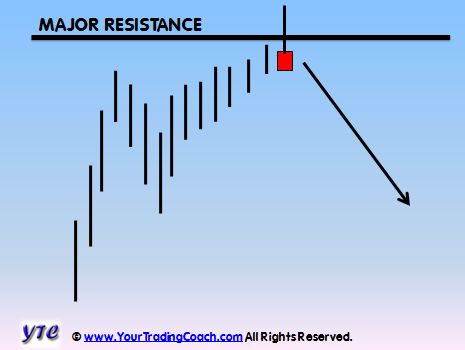
In the diagram above, instead of entering short on a shooting star reversal pattern, just because it matches the shooting star diagram in my book on candlestick patterns, I’m entering short because price just meandered slowly up to a major resistance level. The current price swing has clearly less momentum than both the previous upswing and downswing. And the price bar range is clearly narrowing. This gives a reduced likelihood of the commitment required from the bulls to break through the area of increased supply. The shooting star pattern provides evidence of a clear rejection of prices at that resistance level. This provides me with a lower risk or higher probability trade in the short direction.
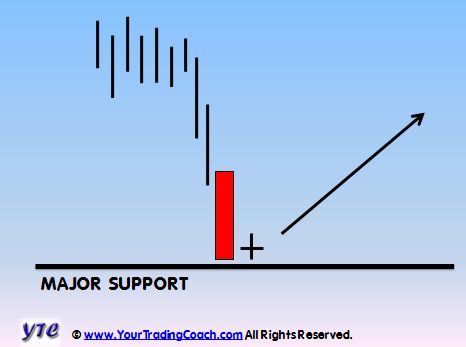
Again, in the diagram above, instead of entering long on a harami cross reversal pattern, just because it matches the harami cross in my book on candlestick patterns, I’m entering long because a strong and accelerating move downward, on greatly increased volume, extended price rapidly to great distances below its average, right into an area of major support. This is an area where I expect increased demand is likely to be sufficient to absorb and overcome the force of the bears who have spent all their energy on the climactic move downwards. This is an area where I expect price to find support. The harami cross shows a clear halting of the rapid move down, and allows me an opportunity to enter a low risk trade close to an area of major price support.
Seriously, the end result might be the same, but at least I’ve entered based on a reasonable assessment of the price action in order to maximize the potential for a lower risk or higher probability trade. Over a lifetime of trading I expect this approach will produce more favorable results than just entering because the pattern matched one I’d memorized from a book.
Ok, time for a bit of a summary. Don’t just blindly take your entry triggers. Think about where they occur within the bigger picture structure of the market.
The market structure defines where you trade. The trigger, whether a candlestick pattern or some other form of entry trigger, tells you when to get in, ONLY when you’ve first met the requirements of the market structure rule.
Think about where the current price movement is within a framework of support and resistance. Think about the changing strength of the current trend, or price swing, as it approaches this area of support or resistance. Watch for signs of strength or weakness in the trend, through the clues evident in changes of momentum and volatility.
And don’t forget – ALWAYS USE STOPS, because there are no guarantees. This is a game of probabilities.
Happy trading,
Lance Beggs
Would you like to learn more about how I trade the forex and equity index markets? Check out the articles, videos and trading resources on my website right now at YourTradingCoach.com .
You are now leaving a Magnifi Communities’ website and are going to a website that is not operated by Magnifi Communities. This website is operated by Magnifi LLC, an SEC registered investment adviser affiliated with Magnifi Communities.
Magnifi Communities does not endorse this website, its sponsor, or any of the policies, activities, products, or services offered on the site. We are not responsible for the content or availability of linked site.