
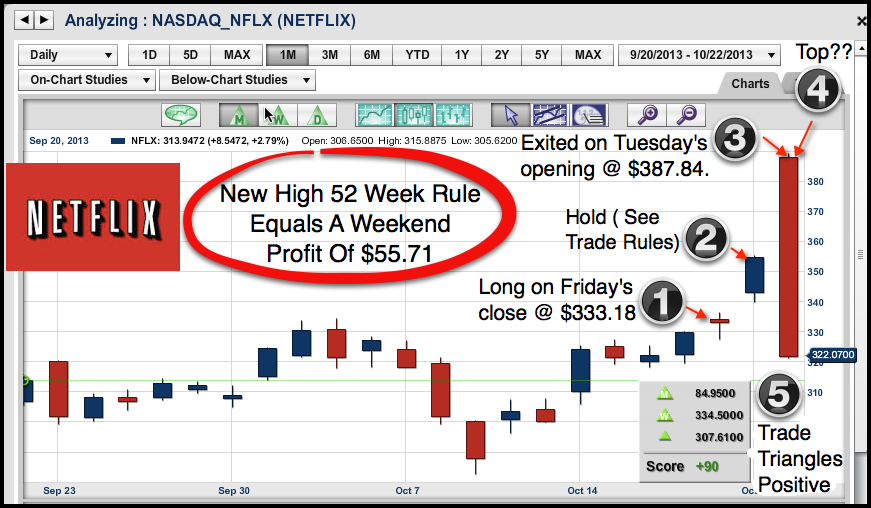
Hello traders everywhere! Adam Hewison here, co-creator of MarketClub, with a special look at Netflix (NASDAQ:NFLX).
Tips and trick from traders on how to become a better trader.
Hello traders everywhere! Adam Hewison here, co-creator of MarketClub, with a special look at Netflix (NASDAQ:NFLX).
Swing trading has been popular for years amongst professional traders. It is a type of trading that tries to catch the various up moves and down moves in a market over the course of a few days to a few weeks. Unlike a longer term trend trader, a swing trader typically uses technical analysis to identify markets with short term momentum.
Swing trading can be a good trading style for beginner traders, as it offers a middle ground between day trading and long term trend trading. However, it can still offer the potential for significant profits for more advanced traders.
One of the key elements to successful swing trading is determining the direction of the major trend. This can be done easily using MarketClub's Monthly Trade Triangle. A green Triangle represents an uptrend and a red Triangle represents a downtrend. Using the chart for SunPower (NASDAQ:SPWR), you can see the green Monthly Trade Triangle was established on December 10, 2012, and has stayed in place for all of 2013.
Since the major trend is up for SunPower (NASDAQ:SPWR), it might be a good candidate to successfully swing trade. How far a market pulls back from a high and subsequently breaks over the previous high, can be used to determine how far that price swing will go. For example, if the price was 10 and the market pulled back to 5, the difference between 10 and 5, is 5. If the market subsequently moved over the previous high of 10, then you would add 5 to 10 and have a target zone of 15.
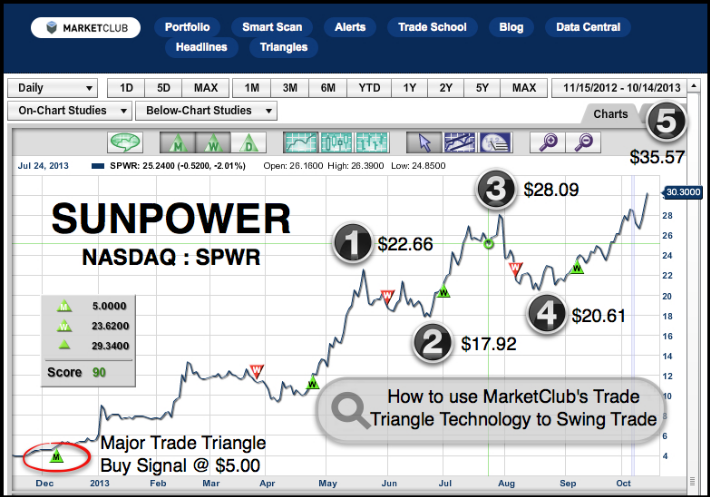
On the chart, you will see the numbers (1) through (5). Next to the number you will see a price point, which represents the highest stock price closing for that particular swing.
At (1), the price point was $22.66. The market then fell to (2) which represents a drop in price of $4.71.
Now, you simply add the price drop of $4.71 to the high price at (1) $22.66, which gives you a new swing point objective of $27.37.
At (3), the price point was $28.09. The market then dropped back to (4) $20.61, which represented a pullback of $7.48.
Now, the market has already moved through (3) $28.09, which is where we add on the pullback amount of (4) $7.48 to (3) $28.09. This produces our next target zone of $35.57.
We will see in the future if that level is achieved.
I hope you are able to apply this suggested method to other markets as well.
As always, I appreciate hearing back from you with your thoughts and ideas on different markets. Until then, I wish you every success in the marketplace.
All the best,
Adam Hewison
President, INO.com
Co-Creator, MarketClub
This morning as I was looking over the news, I read with interest that Carl Icahn had taken a 6% stake in Talisman Energy Inc (NYSE:TLM). Talisman Energy is a large Canadian energy company.
On October 1st, the Trade Triangles flashed a major buy signal for Talisman Energy at $11.95. I suspect that this was partly due to the price action that was reflected by Mr. Ichan's purchase of Talisman shares.
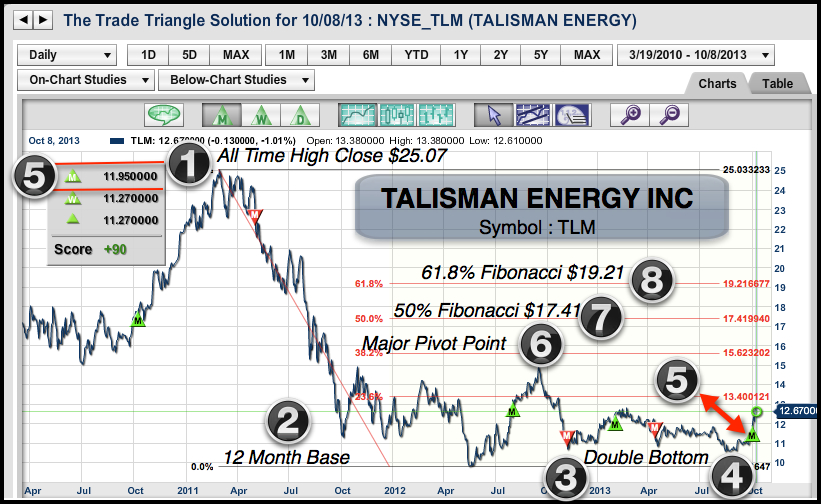
1.All Time High. (2) 12 Month Base. (3) +(4) Double Bottom. (5) Trade Triangle Buy at $11.95.
(6) Major Pivot Point. (7) 50% Fib Retracement $17.41. (8) 61.8% Fib Retracement $19.21.
What is also interesting is how Mr. Icahn picks stocks like Talisman Energy. I have witnessed the same actions in play in several other stocks that Mr. Icahn has purchased in the past 12 months. Stocks like Apple, Netflix, Herbalife, and most recently, Talisman, all display similar characteristics. I suspect that the technicals play a part in his overall approach to the market. The timing of Mr. Icahn's stock purchases are amazingly close to the timing of our Trade Triangle buy signals.
Today, we are looking at a chart of Talisman Energy and the stock action looks good from a technical viewpoint, as well as from our Trade Triangles. The potential for this market to go significantly higher is there, in my opinion. Of course, I will be using our Trade Triangles for money management to exit this position, should it not work out the way I expect it to.
As always, please share your thoughts with us on this or any other market.
Adam Hewison
President, INO.com
Co-Creator, MarketClub
 As we start the new trading week, there are a lot of challenges we are facing with the partial government shutdown still in effect, the looming debt ceiling, and the numerous other problems plaguing the US at the moment.
I cannot imagine that even Congress could be so stupid as to not resolve the debt ceiling. Not to do so would be totally irresponsible and push the US over the proverbial fiscal cliff. Should the unthinkable happen, it would send the world's markets into a tailspin and, chances are, there would be a great deal of discussion about changing the Dollar's currency status.
So, with all that in the background, what stocks or markets are you watching this week? Continue reading "Which stocks or markets are you following?"
One of my all-time favorite songs is from the Kenny Rogers album, "The Gambler" and every investor can learn something from the song's lyrics.
"If you're gonna play the game, boy, ya gotta learn to play it right.
You got to know when to hold 'em, know when to fold 'em,
Know when to walk away and know when to run.
You never count your money when you're sittin' at the table.
There'll be time enough for countin' when the dealin's done."
Here we are 34 years later and the words to that song are every bit as relevant as when they were written. When stocks go up, "you got to know when to hold 'em", and when stocks go south you have to "know when to fold 'em." The words to the song are very simple, but they are, in fact, the essence to successful trading. Continue reading "5 Stocks To Exit Immediately!"
You are now leaving a Magnifi Communities’ website and are going to a website that is not operated by Magnifi Communities. This website is operated by Magnifi LLC, an SEC registered investment adviser affiliated with Magnifi Communities.
Magnifi Communities does not endorse this website, its sponsor, or any of the policies, activities, products, or services offered on the site. We are not responsible for the content or availability of linked site.