We've asked Michael Seery of SEERYFUTURES.COM to give our INO readers a weekly recap of the Futures market. He has been Senior Analyst for close to 15 years and has extensive knowledge of all of the commodity and option markets.
Michael frequently appears on multiple business networks including Bloomberg news, Fox Business, CNBC Worldwide, CNN Business, and Bloomberg TV. He is also a guest on First Business, which is a national and internationally syndicated business show.
Gold Futures
Gold futures in the June contract are trading above their 20 & 100 day moving average telling you that trend has turned higher after settling last Friday at 1,303 going out today at 1,318 up $15 dollars for the trading week as money flowed out of stocks and into bonds and gold. I am neutral in the gold market currently so I’m not recommending any position as the trend is not strong as the chart structure in gold is poor as well which does not allow you to place tight stops minimizing your risk so wait for better chart pattern to develop before entering a new position. If your bullish gold prices look at bull call spreads possibly for the month of June or if you’re bearish look at a bear puts spreads for the month of June limiting your risk to what the premium costs. TREND: HIGHER
CHART STRUCTURE: POOR
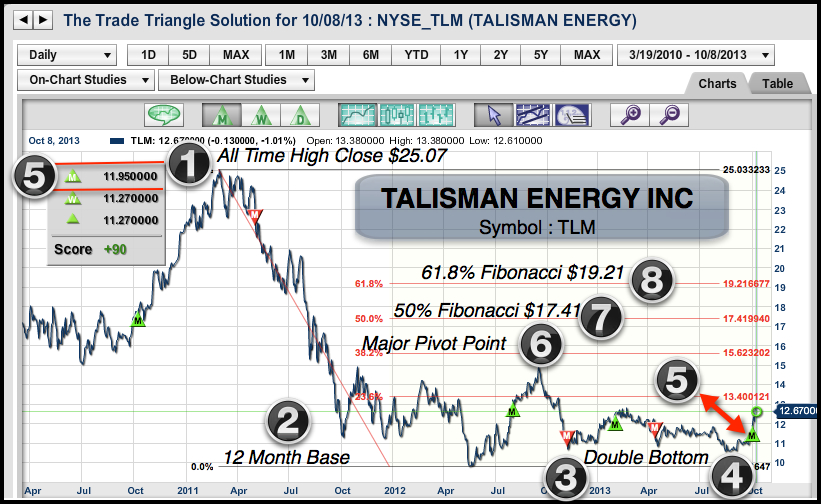
This morning as I was looking over the news, I read with interest that Carl Icahn had taken a 6% stake in Talisman Energy Inc (NYSE:TLM). Talisman Energy is a large Canadian energy company.
On October 1st, the Trade Triangles flashed a major buy signal for Talisman Energy at $11.95. I suspect that this was partly due to the price action that was reflected by Mr. Ichan's purchase of Talisman shares.
1.All Time High. (2) 12 Month Base. (3) +(4) Double Bottom. (5) Trade Triangle Buy at $11.95.
What is also interesting is how Mr. Icahn picks stocks like Talisman Energy. I have witnessed the same actions in play in several other stocks that Mr. Icahn has purchased in the past 12 months. Stocks like Apple, Netflix, Herbalife, and most recently, Talisman, all display similar characteristics. I suspect that the technicals play a part in his overall approach to the market. The timing of Mr. Icahn's stock purchases are amazingly close to the timing of our Trade Triangle buy signals.
Today, we are looking at a chart of Talisman Energy and the stock action looks good from a technical viewpoint, as well as from our Trade Triangles. The potential for this market to go significantly higher is there, in my opinion. Of course, I will be using our Trade Triangles for money management to exit this position, should it not work out the way I expect it to.
As always, please share your thoughts with us on this or any other market.
Adam Hewison
President, INO.com
Co-Creator, MarketClub
Yesterday, I went to the Apple(NASDAQ:AAPL) store to ask them about the new iPhone 5S and to see if they had any in stock. I was told that they no longer sold the iPhone in the store and that I had to order one online. I was somewhat taken aback by this, but then it all sort of made sense to me when I thought about it.
I think the demand for the iPhone 5S, the gold edition in particular, has been off the charts and I think we're going to see a tremendous number of iPhone sales in the fourth quarter. Having checked out the Apple store, I decided to go to Best Buy to see what they had in the iPhone 5S market. It was pretty much the same story, you have to order online and you can pick it up at the store. This makes a lot of sense because Apple can then deliver what people want based on their online orders. This allows Apple to ramp up its production to meet demand.
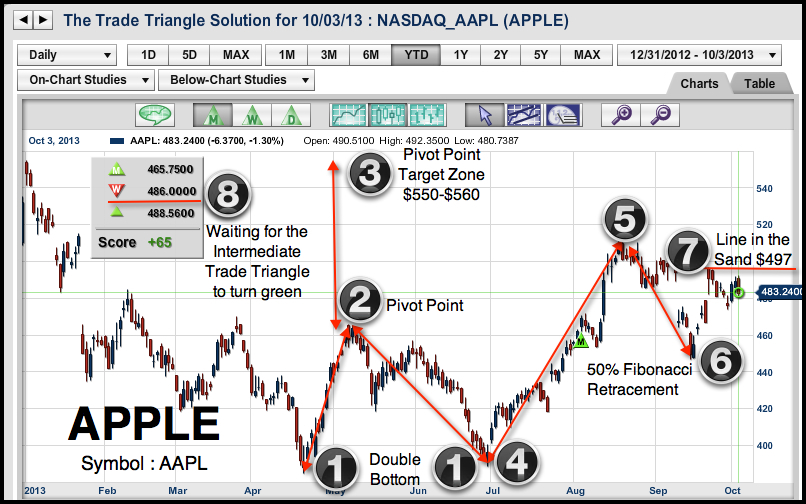
Technical Analysis of Apple , using Trade Triangles, Fibonacci and classic technical analysis.
CHART LEGEND
1) Double Bottom
2) Pivot Point
3) Target Zone from Pivot Point
4-5) Measurement for Fibonacci Retracement
6) 50% Fibonacci Retracement
7) Line In The Sand - $497
8) Trade Triangles
The market action recently for Apple (NASDAQ:AAPL) has been choppy, which I believe is a good thing, as Apple sets itself up to move higher. I have been looking for Apple to move to the $550-$560 area or higher. That target zone is still in effect. The battle lines are drawn and I know that if the market does not rally strongly today, the new trigger point for Apple next week is going to be the $497 level. Once over that level, this market could take off and move very quickly to higher levels.
Leave a comment • Get Involved • Ask a question • Your Opinion Counts
Doubtless, you may have heard some of the problems that have been circulating in the press about the new iPad retina displays, and that they're going to be delayed coming to market. This is likely just a technical glitch that could have been caused by one supplier. I think that demand for the smaller 7in retina iPad is going to be very big both here and overseas.
Lastly, like thousands of loyal Apple fans, I still don't have an iPhone 5S Gold, but I want one. I guess I'm going to have to break down and order online and wait for it to be delivered to the local Apple store. One thing I am really enjoying a great deal is the new iOS7 operating system. Apple has done a masterful job of changing its old and aging operating system into one that really is cutting-edge. The fact that it can run on the new 64-bit A7 chip and the old 32-bit chip is a testimonial to Apple's technical expertise.
As you can see on the chart, I have drawn a line in the sand for Apple and when this line is crossed it will turn our intermediate weekly Trade Triangle green, indicating a resumption of Apple's strong and longer-term uptrend.
If you have any comments or thoughts on Apple, I would love to hear from you!
Have a great weekend everyone and let's watch Apple closely next week, it could be a good one.
All the best,
Adam Hewison
President, INO.com
Co-Creator, MarketClub
We've asked our friend Jim Robinson of profittrading.com to provide his expert analysis of charts to our readers. Each week he'll be be analyzing a different chart using the Trade Triangles and his experience.
Today he is going to take a look at the technical picture of Fuel Systems Solutions, Inc. (FSYS).
I hope you are having a GREAT week !
Let's take a look at FSYS this week.
FSYS made a double bottom base and a huge move higher out of the base, which means sharply higher prices could be on the way for FSYS. Continue reading "Chart to Watch - FSYS"→
My last visit to New York proved to be a very fruitful one as I had the opportunity to attend the Trader's Expo, and more importantly, I got a chance to sit down with Bo Yoder from BoYoder.com. I've known of Bo when I first started here at INO, but he took time out and refocused on some top projects that meant a lot to him. He's back now and I'm excited to introduce you to him, his site, and the article below. Please enjoy the article and comment below so you can make Bo feel welcome!
As the markets fight for a bottom, there is a new wave of interest in the world of active trading and self-directed investing. These new traders have so many wonderful tools available to help guide them and accelerate their learning curve. Archives such as those offered by INO.com have all the information needed to build a solid background as a technically focused trader.
However, many beginning traders fail to understand that technical analysis at its root is the science of interpreting order flow. Let's look at one of the most fundamental technical analysis price patterns... the double bottom.
You are now leaving a Magnifi Communities’ website and are going to a website
that is not operated by Magnifi Communities. This website is operated by Magnifi
LLC, an SEC registered investment adviser affiliated with Magnifi Communities.
Magnifi Communities does not endorse this website, its sponsor, or any of the
policies, activities, products, or services offered on the site. We are not
responsible for the content or availability of linked site.