Crude Oil vs Platinum: You Bet Right

It is just amazing how many times you guess not only the direction but also the peaks and troughs of the prices of different instruments. This is crowd-thinking or crowd-analyzing, when the winning ideas are crystallized into the major wager.

This “market distortion” was spotted in July and it was updated this September. Almost all of you were betting that crude oil and platinum would meet on the price chart again. So, here it is in the chart below.

Crude Oil VS Platinum

Source: TradingView

The magic of your major bet is right here in the making. As the oil price remains stuck in a sideways consolidation, the platinum price is taking quick steps towards "black gold".   

In September, crude oil futures completed their mission as the initial meeting point was set at $75 and the valley was at $76. Hence, the consolidation that followed gave the metal a chance to catch up.

The updated meeting point has been recalculated to be set at $62 for crude oil futures and at $1,160 for platinum futures. This could happen in an ideal situation. Historically, however, one of the instruments has often lagged behind.

Last time I updated the platinum futures chart for you and it played out well according to the bullish option.

Let me update the oil futures chart this time as it has changed a lot. Continue reading "Crude Oil vs Platinum: You Bet Right"

1 Health Care Stock For The Long Term

Following the global pandemic, the healthcare sector is finding new avenues and accelerating diversification strategies to drive growth. Moreover, the healthcare industry has an aging population in its favor. The median human age in 2022 is 30.2 years compared to 20.6 years in 1974.

Many countries have launched policies to fix the aging population and stagnation challenges.

When do you think the median age of humans will start to reduce?

View Results

Loading ... Loading ...

With a market capitalization of $259.40 billion, healthcare stalwart Merck & Co., Inc. (MRK) continues strengthening its pipeline through trials, approvals, and collaborations. KEYTRUDA, an oncological drug, primarily drove the company’s business momentum.

Additionally, the company is looking to bolster its oncological pipeline. Last month, MRK and Moderna, Inc. (MRNA) announced that MRK had exercised its option to jointly develop and commercialize a personalized cancer vaccine (PCV). The costs and profits of this collaboration are expected to be shared by the companies.

On top of that, in September, MRK’s Animal Health segment acquired Vence, a virtual fencing innovator for rotational grazing and livestock management, thereby broadening its portfolio.

The company has also raised its expected full-year 2022 worldwide sales to a range of $58.5-$59.0 Billion, reflecting a growth of 20-21%. The company also raised its full-year 2022 non-GAAP EPS outlook to a range of $7.32-$7.37.

The stock has gained 23.9% over the past year and 33.5% year-to-date to close its last trading session at $102.31. It has gained 8.7% over the past month and is trading higher than its 50-day and 200-day moving averages of $92.71 and $87.87, respectively.
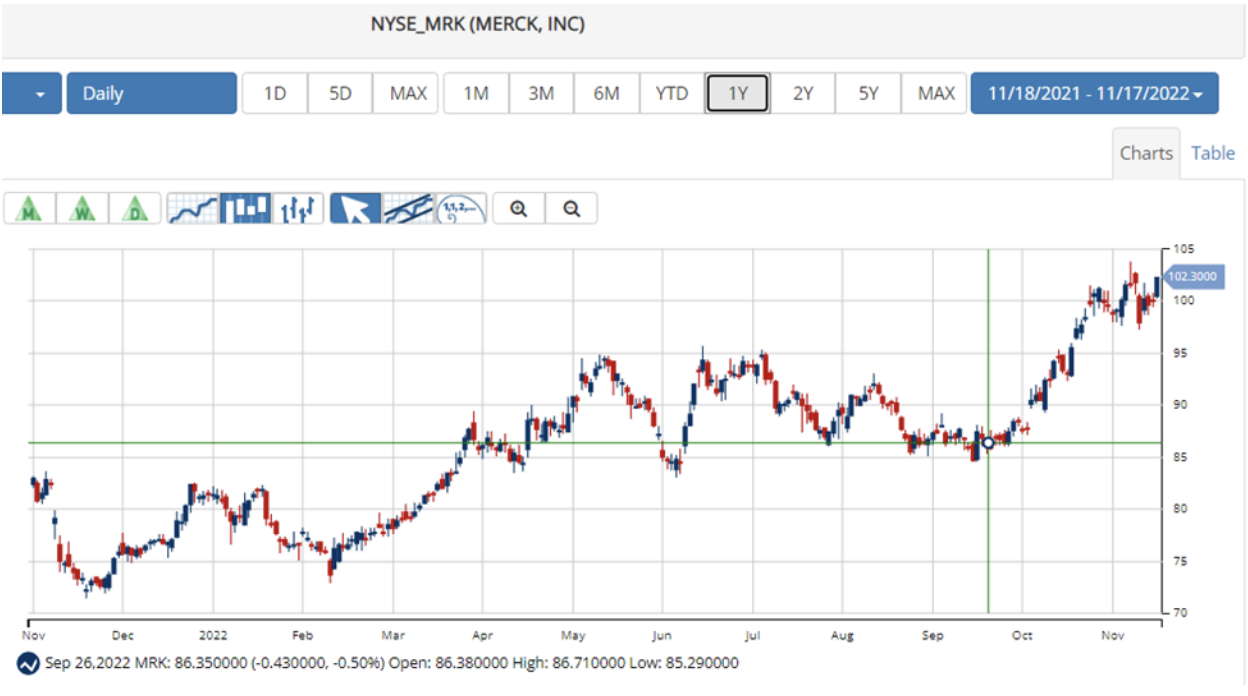
MRK Chart

Source: MarketClub

Here are the factors that could influence MRK’s performance:

Sound Financial Growth

For the fiscal third quarter of 2022, MRK’s sales increased 14% year-over-year to $14.96 billion. Excluding certain items, its non-GAAP net income and non-GAAP EPS came in at $4.7 billion and $1.85, respectively, up about 4% from their year-ago values.

Growth in oncology was driven by revenues from KEYTRUDA, which increased approximately 20% from the prior-year period to $5.43 billion, while growth in vaccines was mainly due to higher GARDASIL / GARDASIL 9 sales, which grew 15% year-over-year to $2.29 billion.

Discounted Valuation

In terms of its forward P/E, MRK is trading at 17.21x, 31.7% lower than the industry average of 25.21x. The stock’s forward non-GAAP PEG multiple of 1.36 is 24.8% lower than the industry average of 1.80.

In terms of its forward EV/EBIT, the stock is trading at 12.16x, 30.6% lower than the industry average of 17.52x. Its forward Price/ Cash Flow multiple of 13.05 is 21.2% lower than the industry average of 16.56.

Strong Past Growth

MRK’s revenue grew at an 8.7% CAGR over the past three years and an 8.2% CAGR over the past five years. In the last three years, its EBIT and net income grew at CAGRs of 10.7% and 17.9%, respectively. Its EPS also increased at an 18.8% CAGR over the same period.

Favorable Analyst Estimates

The consensus EPS estimate for the current year (fiscal 2022) of $7.38 indicates a 22.6% year-over-year improvement. Likewise, the consensus revenue estimate of $59.11 billion for the same year reflects a rise of 21.4% from the prior year. Moreover, analysts expect MRK’s EPS to grow 11.1% per annum over the next five years.

Attractive Dividend Growth

In July, MRK declared a dividend of $0.69 per share of the company’s common stock for the fourth quarter of 2022. Its annual dividend of $2.76 yields 2.7% on the current share price. It has a four-year average yield of 2.95%.

The company’s dividend payouts have increased at a 9.6% CAGR over the past three years and a 9% CAGR over the past five years. The company grew its dividend payments for 11 consecutive years.

Technical Indicators Look Promising

MarketClub’s Trade Triangles show that MRK has been trending UP for all three-time horizons. The long-term trend has been UP since October 1, 2021, the intermediate-term trend has been UP since October 10, 2022, and the short-term trend has been UP since November 17, 2022.
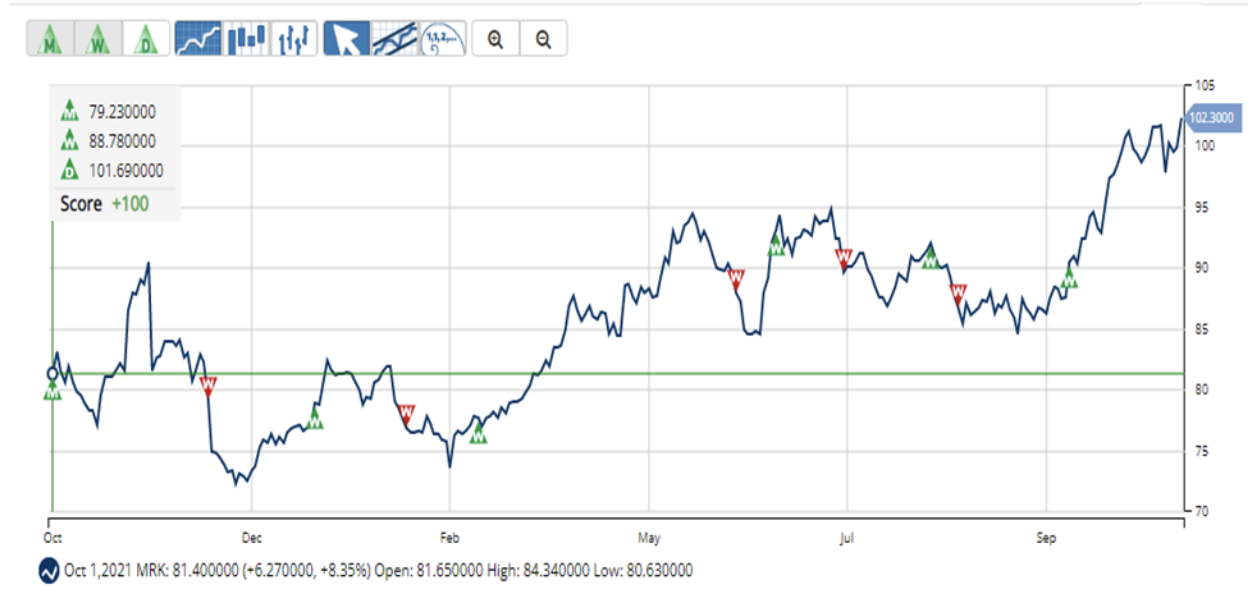
MRK Chart

Source: MarketClub

The Trade Triangles are our proprietary indicators, comprised of weighted factors that include (but are not necessarily limited to) price change, percentage change, moving averages, and new highs/lows. The Trade Triangles point in the direction of short-term, intermediate, and long-term trends, looking for periods of alignment and, therefore, strong swings in price.

In terms of the Chart Analysis Score, another MarketClub proprietary tool, MRK scored +100 on a scale from -100 (strong downtrend) to +100 (strong uptrend), indicating that the stock is in a strong uptrend which is likely to continue. Traders should protect gains and look for a change in score to suggest a slowdown in momentum.

Chart Analysis Score

The Chart Analysis Score measures trend strength and direction based on five different timing thresholds. This tool considers intraday price action; new daily, weekly, and monthly highs and lows; and moving averages.

Click here to see the latest Score and Signals for MRK.

What's Next for Merck & Co., Inc. (MRK)?

Remember, the markets move fast and things may quickly change for this stock. Our MarketClub members have access to entry and exit signals so they'll know when the trend starts to reverse.

Join MarketClub now to see the latest signals and scores, get alerts, and read member-exclusive analysis for over 350K stocks, futures, ETFs, forex pairs and mutual funds.

Start Your MarketClub Trial

Best,
The MarketClub Team


su*****@in*.com


3 Consumer Stocks For Your Watchlist

Despite inflation moderating slightly for October, the Fed doesn’t seem to be in the mood to pause the interest rate hike just yet. The continued rate hikes might bring further pain for businesses showing signs of a slowdown, with the cut in earnings estimates.

Since the market volatility is unlikely to catch a break anytime soon, shares of fundamentally strong, consumption-driven businesses, with demand and margins immune to an economic slowdown, seem ideal investments for potential upsides while ensuring adequate downside protection.

What do you think benchmark interest rates will be a year from now?

View Results

Loading ... Loading ...

Hence, it would be opportune to add BJ's Wholesale Club Holdings, Inc. (BJ), Casey's General Stores, Inc. (CASY), and Lifeway Foods, Inc. (LWAY) as some technical indicators point to sustained upsides in them amid prevailing uncertainties.

BJ's Wholesale Club Holdings, Inc. (BJ)

BJ operates majorly on the east coast of the United States as a warehouse club operator. The company offers a curated assortment of perishables and other grocery products, general merchandise, gasoline, and other ancillary services.

Over the last three years, BJ’s revenues grew at an 11.6% CAGR, while its EBITDA grew at an 18.7% CAGR. The company’s net income grew at a 32.6% CAGR during the same period.

For the fiscal 2022 second quarter, ended July 30, 2022, BJ’s revenue increased 22.2% year-over-year to $5.10 billion, driven primarily by higher gasoline sales. During the same period, the company’s income from continuing operations and adjusted EBITDA increased 27% and 24.3% year-over-year to $141.01 million and $273.7 million, respectively.

BJ’s adjusted net income for the quarter came in at $144.30 million or $1.06 per share, up 27.3% and 29.3% year-over-year, respectively.

Analysts expect BJ’s revenue and EPS for the fiscal year ending January 2023 to increase 14.8% and 11% year-over-year to $19.13 billion and $3.61, respectively. Both metrics are expected to keep growing over the next two fiscals. Moreover, the company has impressed by surpassing consensus EPS estimates in each of the trailing four fiscals. Continue reading "3 Consumer Stocks For Your Watchlist"

Walmart Reminds Us Buyback Programs Aren't Dead

Now that the economy is less rosy looking than a year or two ago, fewer company executives report or discuss share-buyback programs.

However, in the most recent quarterly earnings report from Walmart (WMT) we got just that, a big, new buyback announcement. Wal-Mart announced a new $20 billion share buyback program, and it should be noted that Walmart is currently just a $400 billion company.

While on the surface, a 5% buyback amount may not seem like a lot, if you dig deeper into Walmart, that 5% buyback, in reality, turns into a 10% buyback based on today's market capitalization. The reason is the Walton family and family trust and foundation control a little more than half of all Walmart shares.

While the family and its Foundation do sell stock from time to time, they have never sold a sizable enough amount to really move the needle. Thus, it is likely that the $20 billion buyback Walmart announced will be purchasing shares not owned by the Walton family and therefore coming from the stock trading on the open market, which is less than 50% of shares outstanding.

Owning a stock like Walmart or, even better, AutoZone (AZO), which has repurchased around 85% of its stock since 1998, can increase the value of your portfolio over decades of ownership. This occurs even when the company you own operates in a boring, slow-growth, or even cyclical industry, like retail.

Now there is some debate about whether or not you would rather have a company you own buy back stock or pay you a larger dividend.

Some investors would instead take a more significant dividend so they can invest it in other stocks, while some investors would rather that money be used to buy back stock.

This is honestly one of those situations where it is more or less a personal decision on which way you would rather a company give you back part of the profits it earns. Continue reading "Walmart Reminds Us Buyback Programs Aren't Dead"

Gold Sector Opportunities: OR & ARNGF

Following a brutal two years for the Gold Miners Index (GDX), the sector has begun to perk up recently, advancing more than 20% off its lows to new 50-day highs.

This recovery can be attributed to the recent rally in gold back above the psychological $1,750/oz level and the fact that many miners had overshot to the downside during this bear market. In fact, many were trading at their most attractive valuations since 2018, when the gold price was hovering below $1,250/oz, and they were much less profitable.

Given the steep decline in the sector, several gold miners are trading at deep discounts to fair value.

In this update, we’ll look at two more attractive opportunities in the gold sector. Not only do these two companies have industry-leading growth profiles, but they have been beaten up sufficiently due to negative sentiment sector-wide that they’re offering considerable margins of safety at current levels.

Osisko Gold Royalties (OR)

Osisko Gold Royalties (OR) is a $2.33BB market cap royalty/streaming company in the gold sector, giving it a very low-risk business model. This is because the company generates revenue and cash flow from royalties and streams that it has purchased from developers and producers in exchange for helping them fund the construction or expansions of their projects/operations.

The result is that Osisko does not have to pay for sustaining capital to maintain these mines, it does not have to pay growth capital to expand these mines, and it is not subject to inflationary pressures if we see rising labor, fuel, explosives, or cyanide costs. Given this attractive business model, the company has reported year-to-date cash margins of 93% and 92% in its most recent quarter.

Osisko Chart

(Source: Company Presentation

Continue reading "Gold Sector Opportunities: OR & ARNGF"