Chart Spotlight: Albemarle Corp. (ALB)

Governments all over the world are pushing for a greener future.

The U.S. wants to cut emissions by up to 52%. Europe says it’ll cut emission by up to 55%. China says it will stop releasing CO2 in the next 40 years.

To help, leaders want millions of zero-emission electric vehicles on the roads as of yesterday.

The International Energy Agency (IEA) estimates we could see 135 million EVs in the next 10 years. Analysts at Ernst & Young say EV sales could outpace combustion engines in Europe, China, and the U.S. in the next 12 years.

There’s just one problem.

Every electric vehicle requires 22 pounds of lithium - the main ingredient in rechargeable batteries and energy storage devices.

Unfortunately, we don’t have enough supply to meet demand.

In fact, according to Investing News, “With sales of electric vehicles expected to continue to surge in key markets, demand for lithium is forecast to grow exponentially, and if there’s one thing producers agree on is that more supply is needed. Figures as to how much output will be required vary slightly, but the speed at which the industry has to scale up to reach those levels is unprecedented.”

That being said, I expect to see higher highs for lithium prices, and for related stocks, like Albemarle Corp. (ALB), the industry’s 800-pound gorilla.

Fundamentally, ALB is undervalued, trading with a PEG ratio of just 0.50. With lithium demand only rising, I don’t expect for ALB to remain undervalued for long.

Plus, the company recently raised its guidance twice. In May, for example, the company raised its forecast for the full-year, noting it expects for 2022 sales to come in between $5.8 billion and $6.2 billion. Adjusted EBITDA is now expected to come in between $2.2 billion and $2.5 billion, with adjusted EPS of between $9.25 and $12.25.

ALB stock is also technically oversold. In fact, if we pull up a one-year chart, we can see the stock just caught double bottom support dating back to April. We can also see the stock is oversold at its lower Bollinger Band, with over-extensions on Williams’ %R, Fast Stochastics, and RSI.

ALB Chart with Trade Triangles

Source: MarketClub

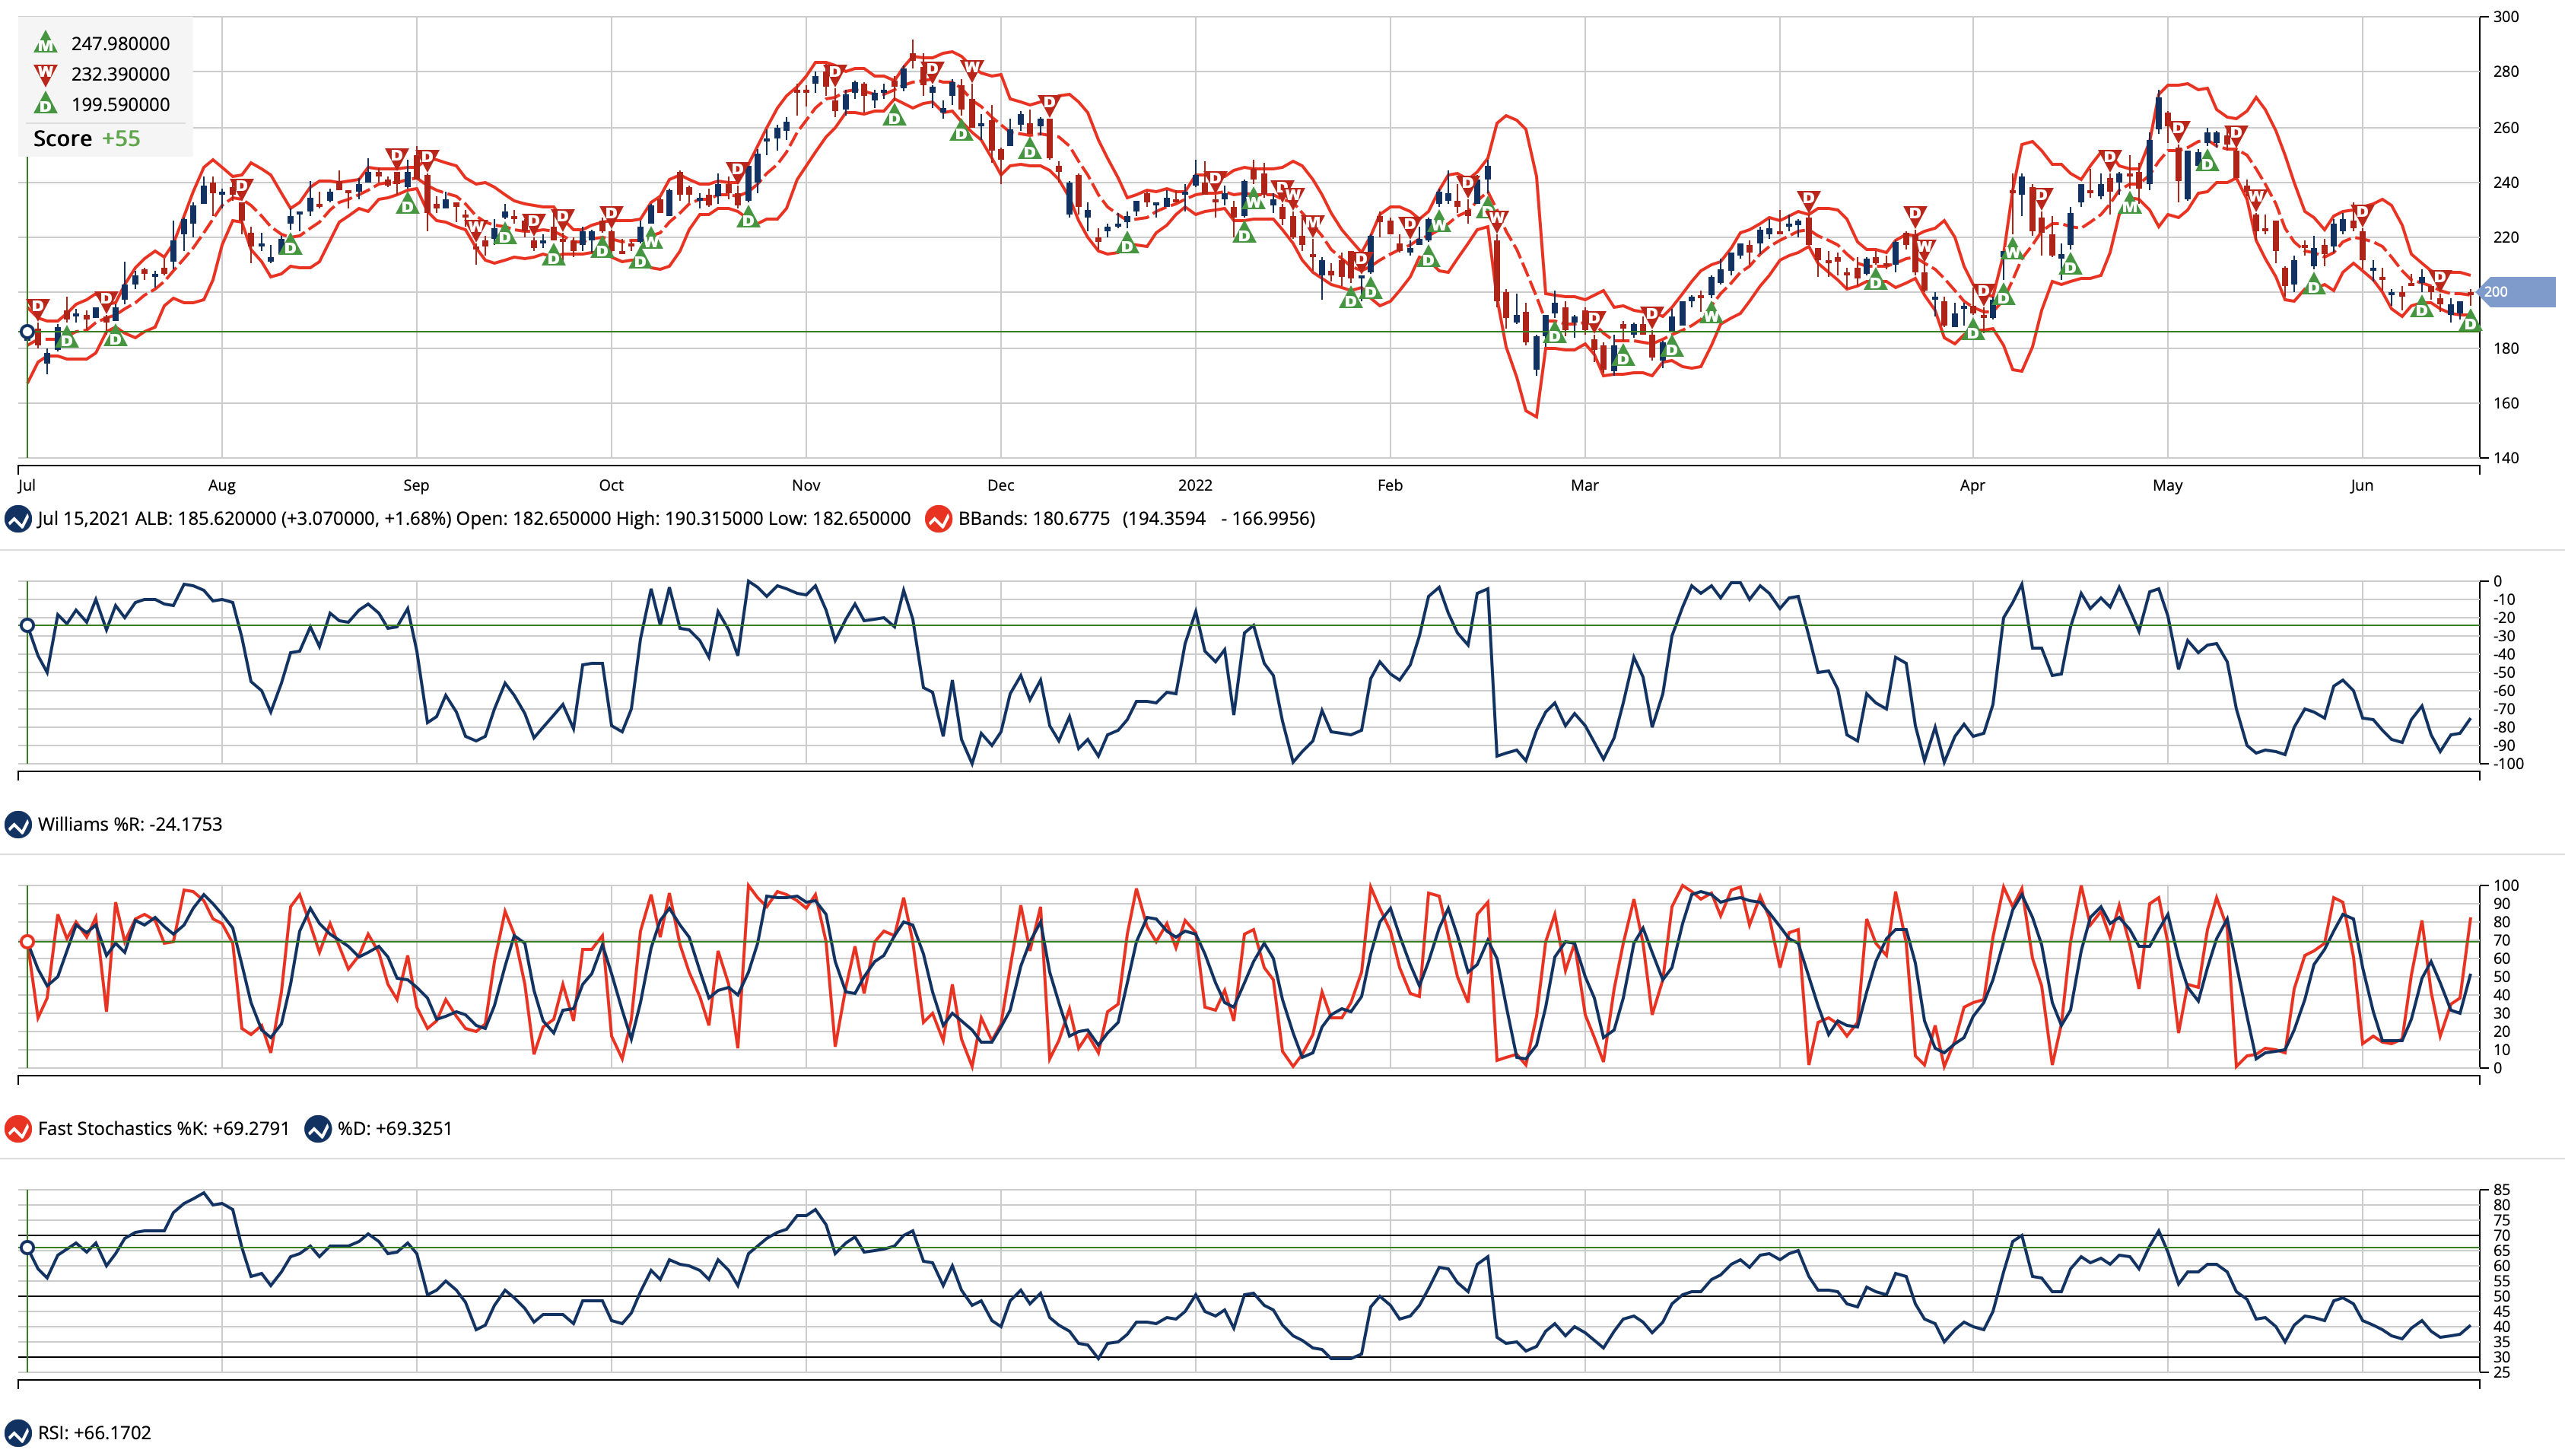
From a current price of $198.65, I’d like to see Albemarle Corp. (ALB) refill its bearish gap around $230 a share initially. Longer-term, I’d like to see it closer to $250.

Ian Cooper
INO.com Contributor

Disclosure: This contributor did not hold a position in any investment mentioned above at the time this blog post was published. This article is the opinion of the contributor themselves. The above is a matter of opinion provided for general information purposes only and is not intended as investment advice. This contributor is not receiving compensation (other than from INO.com) for their opinion.

S&P 500 Bullish Divergence

Last September, I called the S&P 500 index to lose 30% according to the projection based on a comparative analysis.

The index price was at $4,459 that time. The deepest valley since then was established at $3,637 last month. 18% of the index value evaporated since the idea had been posted and 25% from the top of this January ($4,819).

The majority of you voted for 10%-20% retracement and this was the closest call so far as we cannot be sure whether it is over or not.

To remind you, I had put together two ETFs and the S&P 500 index (black). I chose Vanguard Value Index Fund ETF (VTV) (red) and Vanguard Growth Index Fund ETF (VUG) (blue). Let us check the updated comparison chart below.

SP500 VTV VUG Comparison Chart

Source: TradingView

The bearish alert appeared to me when the value stocks (VTV, red) stopped contributing to the rise of the broad index. Moreover, the gap between the latter and the growth stocks (VUG, blue) has widened tremendously.

The retracement targets for VUG and the S&P 500 were based on the corresponding level of underlying / less performing instrument: for VUG it was the S&P 500 and for the S&P 500 – VTV.

It is amazing how accurately the VUG target at $217 was hit last month as the ETF dropped even lower in the valley of $213. The concept played out precisely as the VUG bounced off the broad index, blue bars approached but did not overlap black bars.

The S&P 500 index almost closed the gap with the VTV last month, however the VTV itself also dropped and hence wasn’t caught up. The retracement target has been set at $3,200 last September and the lowest level has been seen since then was $3,637 last month.

Let us look at the S&P 500 chart below to see what could happen next.

SP500 Weekly Chart

Source: TradingView

The price has shaped a familiar model of the Falling Wedge (purple) within the current retracement. The amplitude of fluctuations decreases as the price approached the apex of the pattern.

The RSI indicator has already built the invisible Bullish Divergence as it can be seen only through its readings: 30.2 vs. 30.5, which means higher valley versus the lower bottom in the price chart.

This combination of narrowing trendlines and bullish diverging indicator could result in the possible breakup anytime soon. Would it be a reversal or a dead cat bounce?

I added two paths on the chart. The red zigzag shows how the Falling Wedge would play out in the first place. The target (purple flat line) is located at the widest part of the pattern added to the breakup point. It coincides with the 61.8% Fibonacci retracement level at $4,367. It could be a double resistance.

The following drop should complete the complex correction down to $3,185. This target was calculated by subtracting the size of the Falling Wedge from the target of that pattern. And again, this area corresponds amazingly with the 61.8% Fibonacci retracement level and the first chart target based on a comparison with VTV.

The green path implies the sideways consolidation that should keep within the existing range of $3,637-$4,819.

Which way do you think the S&P 500 will go?

View Results

Loading ... Loading ...

Intelligent trades!

Aibek Burabayev
INO.com Contributor

Disclosure: This contributor has no positions in any stocks mentioned in this article. This article is the opinion of the contributor themselves. The above is a matter of opinion provided for general information purposes only and is not intended as investment advice. This contributor is not receiving compensation (other than from INO.com) for their opinion.

Own Cannabis Stocks For Less Than $20

The broad market is still wobbly, with inflation showing no signs of cooling.

Not helping, consumer prices soared 9.1% in June, year over year – its fastest pace since 1981, and well above expectations for 8.8%.

According to CNBC, “Excluding volatile food and energy prices, so-called core CPI increased 5.9%, compared to the 5.7% estimate. On a monthly basis, headline CPI rose 1.3% and core CPI was up 0.7%, compared to respective estimates of 1.1% and 0.5%.”

“The breadth of the price gains shows how rising costs have seeped into nearly every corner of the economy. Grocery prices have jumped 12.2% compared with a year ago, the steepest such climb since 1979. Rents have risen 5.8%, the most since 1986. New car prices have increased 11.4% from a year earlier. And average airline fares, one of the few items to post a price decline in June, are nevertheless up 34% from a year earlier,” added the Associated Press.

Hopefully, inflation is starting to peak, but it’s a tough call at this point.

The latest numbers could force the Federal Reserve to hike rates another 75 basis points, which then runs the risk of the central bank overshooting, potentially pushing the U.S. economy closer to a recession.

Thankfully, there are some bright spots in the market.

The cannabis sector happens to be one of them.

In fact, the sector, as measured by the Advisor Shares Pure US Cannabis ETF moved slightly higher from a low of $10.08 to a recent high of $10.87 over the last week.

That’s happening for a few reasons. Continue reading "Own Cannabis Stocks For Less Than $20"

Are We Returning To Normal?

It may be time to start thinking that this recent bout of high inflation won’t really last as long as we thought.

Right now the outlook is starting to look fairly positive: Oil prices are coming down, the chip crisis seems to be over — the shortage has quickly turned into a glut — supply chain problems have eased.

At the same time, technology will continue to make things more efficient, just as it did before the Covid-19 lockdown, thus easing price pressures.

Retailers are overloaded with inventory and are already unloading it at steep discounts. And stores can only raise prices so much before consumers say no. Do I really need that $6 box of cereal? Probably not.

Does this mean the Federal Reserve won't need to be as aggressive in raising rates as we thought? Was the Fed - dare I say it — correct after all in believing that inflation was transitory, and the only thing they got wrong was how long that temporary period would be and how high inflation would rise?

Maybe it won't be as long as most everyone thinks. Like most things lately in the U.S. — climate, Covid, the economy — crises never turn out to be as bad as the panic-mongers would have us believe.

Indeed, consumers don’t appear as worried about inflation as most people think. Consumer confidence numbers have dropped sharply, it’s true, but retail sales have held up, witness the 1.0% rebound in June after falling 0.1% the prior month, according to last Friday’s report.

That’s mainly because we still have a robust job market and incomes continue to rise, maybe not at the same rate as inflation but not far behind. The economy added 372,000 jobs in June, down slightly from May’s gain of 384,000 but 100,000+ more than forecasts.

The unemployment rate remained near the 50-year low of 3.6% and about where it was before the pandemic. Most importantly, perhaps, average hourly earnings rose 5.1% in June from a year earlier, not far below the core inflation rate of 5.9%.

Does this mean we’re out of the inflationary woods that our monetary and fiscal authorities have largely created by flooding the economy with money when it wasn’t totally necessary? I wouldn’t go that far.

While income gains seem to be running only a little behind the rate of inflation, the same can’t be said for interest rates. On Friday the yield on the U.S. Treasury’s benchmark 10-year note had fallen below 3.0%. Can the Fed realistically get inflation down to its target rate of 2% if inflation is double that on long-term bond yields? It doesn’t seem possible.

However, it’s useful to note that other bellwether rates have risen closer to the rate of inflation, thanks to the threat/promise of more Fed rate hikes. Specifically, the average rate on a 30-year fixed-rate mortgage in June hit 5.52%, according to Freddie Mac, more than 200 basis points above where it stood at the beginning of the year.

That’s certainly not good news if you’re planning to finance the purchase of a house soon, but it does stand the possibility of removing some of the froth from the housing market — both purchases and rentals — that is keeping many young people from starting out on their own. Long term, that’s a good thing.

More than any other statistic, perhaps, housing costs were an area where the Fed proved woefully inept in measuring inflation over the past decade or so.

Ever since the global financial crisis of 2008, the Fed banged its collective head against the wall trying to raise the inflation rate to 2%, while all along inflation was running well above that, if only the Fed’s army of Ivy League-trained economists had paid attention to what was going on around them in home prices and rents.

So where does that leave us? Is the Fed going to stop tightening because inflation may appear to be under control? No, nor should it.

For the past 15 years or so, ever since the end of the global financial crisis in 2008, we’ve heard constant pleas (including from yours truly) that monetary policy needs to “normalize,” meaning to some traditional, pre-2008 level of interest rates. Alas, it never came to pass.

The post-crisis economic growth rate was never strong enough to persuade the Fed to ease monetary policy and raise interest rates significantly. Then we had the pandemic, which moved everything back to square one, with Fed policy going well beyond where it had ever gone before.

Now, with the economy still growing fairly strongly despite multiple obstacles — supply chain disruptions, war in Ukraine, inflation — that should give the Fed comfort to continue to raise rates and reduce its balance sheet without overly disrupting consumers, who continue to travel, eat at restaurants, and go to ballgames.

Let’s hope it doesn’t lose its nerve as it has multiple times before. That should be a boon to stocks, which could certainly use a lift.

It’s time to get back to normal.

George Yacik
INO.com Contributor

Disclosure: This article is the opinion of the contributor themselves. The above is a matter of opinion provided for general information purposes only and is not intended as investment advice. This contributor is not receiving compensation (other than from INO.com) for their opinion.

New Overnight Exposure ETFs

It's no secret that big moves happen during "extended" trading hours. These extended hours are those that come before and after the markets' standard hours.

During these hours, 4:00am until the market opens at 9:30am Eastern and after then again when regular trading ends at 4:00pm until 8:00pm Eastern, company earnings are reported, merger and acquisition news is posted, and a slew of other big newsworthy events trickle out to investors. Newer retail traders may not know about these ‘extended’ trading hours, but those who follow the markets closely understand the importance of this time.

These extra hours of trading are so important because, during the morning session, it more or less sets the tone for the overall trading day.

In the pre-market hours, we received a few earnings reports that make stocks move in one direction or another. But more importantly during the morning session, investors receive a lot of the economic data that will dictate what is occurring in the economy and thus cause the market to move one way or the other.

During the after-hours trading period, from 4:00pm until 8:00pm Eastern, investors are hit with more company-specific news, such as the bulk of earnings reports, conference calls, company-specific ‘material’ or special information, and mergers and acquisitions.

These more company-specific news events cause individual stocks to make massive moves either higher or lower, but typically won't effect the overall markets the same as the economic data and reports that are released pre-market.

And then, of course, we also have the none stock market or economic data news, such as bombings, terrorist attacks, weather events, etc. These news stories are unpredictable but can push and pull the prices of individual stocks or the broader market. Even those that occur during non-regular trading hours, and perhaps don’t directly relate to businesses that trade on the market could still have an overall effect on the price of stocks (both positively or negatively).

How can we take advantage of these pre and postmarket moves?. The fund managers of two new exchange-traded funds (ETFs), the NightShares 500 ETF (NSPY) and the NightShares 2000 ETF (NIWM) believe they have a strategy to leverage these times of volatility. The back-tested theory behind these ETFs has found that by owning stocks during the non-regular trading period and then selling them during regular trading times, you would have performed better than the overall market.

Just this year, for example, the S&P 500 is down 18%, but during the non-regular trading hours, it's only down 10%. The Russell 2000 has a similar story, down 21% during regular trading hours and only 7% if you where just invested overnight according to AlphaTrAI.

The NSPY is a fund that will track the S&P 500 while the NIWM will track the Russell 2000. Both funds are intended to be held for just one day at a time, since they will be using futures, options, and derivatives to gain exposure to the markets. Furthermore, each fund will offer investors 1X exposure to their corresponding index during regular trading hours and 1.5X exposure during the overnight period. These exposure percentages are before fees and expenses.

Due to the methods being used to gain exposure and the fees and expenses, these products are not intended to be held for long periods of time and will lose value due to contango and other factors at play. Therefore, NSPY and NIWM are not necessarily intended for long-term buy-and-hold investors, although they can be. These ETFs will primarily be used to hedge against risk or purchased daily by traders whom want broad exposure to the overnight market.

Both funds went live the last week of June 2022, so performance data is not yet known. However, we do know that each fund has an expense ratio of 0.55%, which is much higher than index-tracking ETFs, but about in line with a niche fund offering very special exposure.

There are not currently any ‘overnight short’ ETFs available to investors, likely because Alphatrai Funds, the issuer of both NSPY and NIWN, believes the overnight market is more bullish. But, if you are insistent on being short overnight, you could always short these ETFs and buy put options contracts, if and when options become available for these funds.

If you are invested long term in stocks, you already have ‘overnight’ exposure, since you are not likely buying at the open and selling at the close each and every day. However, even for long term investors, having a way to ‘hedge’ risk when the market is not open each evening, or maybe even more importantly during the weekend, is always nice and may help you sleep better, especially during times when the market is abnormally turbulent.

Matt Thalman
INO.com Contributor
Follow me on Twitter @mthalman5513

Disclosure: This contributor did not hold a position in any investment mentioned above at the time this blog post was published. This article is the opinion of the contributor themselves. The above is a matter of opinion provided for general information purposes only and is not intended as investment advice. This contributor is not receiving compensation (other than from INO.com) for their opinion.