Free Educational Webinar: "Insider's" Secrets

Imagine learning the strategies that successful fund managers are using right now to invest and trade in this market - the worst market in 50 years.

Knowing the strategies professional traders use to deliver profits to their investors can inform and support your own trading.

Our friend, Adam Mesh, is inviting you to an educational webinar on Thursday, July 14th, at 1PM (ET) where he will be joined by Jay Hatfield from the C-suite at Infrastructure Capital Advisors, an extremely successful ETF company.

They are going to share the inside strategies and tactics they have used to build their Infracap Equity Income Fund.

Save My Seat

This educational webinar is designed to help you become the best trader/investor you can be and may even open your eyes to opportunities you may have never imagined in the markets.

If you want to be a better trader and investor, click here right now and show up on Thursday!

Enjoy,
The INO.com Team

P.S. This is an educational event. There is nothing to buy... come ready to learn.

Has The FED Broken Inflation?

On Tuesday, July 5th, Crude Oil collapsed very sharply, down over 10% near the lows, in an aggressive breakdown of the price. The $97.43 lows reached that day were more than -14% from recent highs (set on June 29, 2022) and more than -21% from highs set on June 14, 2022.

Consumer Discretionary Spending Likely To Fall Further

Recently, I shared a similar breakdown that took place in Crude Oil in 2009 and how tightening consumer spending often correlates with peaks in Crude Oil when crisis events happen.

Within that research article, I shared this chart highlighting the collapse in the Consumer Discretionary sector that preceded the downward collapse in Crude Oil. The interesting facet of this chart is we can see the inflationary price pressure in Crude Oil (and the general economy) countered by pressures put on consumers in the lower IYC price chart.

Consumers Lead The Global Economy – Watch IYC Closely

As prices rise, consumers are put under extreme pressure to keep their normal standard of living. As inflationary pressures continue, consumers make necessary sacrifices to manage their budgets – often going into debt in the process.

Eventually, this cycle breaks, and inflationary trends end. This is clearly evident on the chart below in July 2008 – as IYC, the Consumer Discretionary sector, collapsed by more than 27% before Crude Oil finally peaked and broke downward.

Crude Oil Daily Chart

Since November 2021, IYC Has Fallen More Than -37%

This current Weekly Crude Oil & IYC Chart shows IYC has collapsed by more than -37% from the November 2021 highs – well beyond the -27% collapse in 2008 that preceded the 2008-09 Global Financial Crisis event. Is the current collapse in IYC a sign that a broad global crisis event has already begun to unfold beneath all the news and hype? Will Crude Oil collapse below $75ppb as the global economy shifts away from inflationary price trends and bubbles burst?

Crude Oil Daily Chart

The Deflationary Price Cycle Is Not Over Yet

If IYC falls below $55 in an aggressive downward price move, I would state the risks of a global deflationary price cycle (or extended recession) are still quite elevated. Currently, the $55 price level in IYC aligns with early 2019 price highs and reflects an extended price advance from the $12~$15 IYC price levels in 2008-09.

If the $55 IYC price level is breached to the downside, I expect the $37.50~$40.00 price level to become future support – as that price level reflects the COVID-19 event lows.

Still, these lower price targets represent an additional -32% decline in IYC and reflect a total of a -57% collapse in the Consumer Discretionary sector from the November 2021 peak levels. The potential target range of $37.50~$40.00 correlates with the 2008-09 GFC collapse range when IYC fell from $18 to lows near $8 (nearly -57%).

We are still very early in the shifting deflationary cycle phase after the US Fed started raising interest rates. Learn to protect and profit from this global event with my specialized investment solutions.

Learn more by visiting The Technical Traders!

Chris Vermeulen
Technical Traders Ltd.

Disclosure: This article is the opinion of the contributor themselves. The above is a matter of opinion provided for general information purposes only and is not intended as investment advice. This contributor is not receiving compensation for their opinion.

Worst First-Half Since 1970 - Time To Capitalize?

This has been the stock market’s worst first-half in over 50 years with inflation serving as the main culprit and a slew of ancillary pressures from China’s Covid lockdowns and the Ukraine/Russia conflict.

Through the first six months, no sector has been immune from the breath and reach of this bear market. The S&P 500, Nasdaq and Russell 2000 are well in bear market territory at June’s end.

Risk appetite across the spectrum has been eroded. The crypto market has collapsed, traditional IPOs and SPACs have dried up and several commodities have collapsed as of late.

Despite this massive wealth destruction, strategists from major Wall Street firms are forecasting that stocks will recapture most of their losses in the back half of the year.

The S&P 500 is expected to finish the year more than 20% higher from the end of June’s levels per the average year-end target derived from the top 15 Wall Street strategists. This forecast translates into the market recapturing most of the year’s losses, albeit finishing the year with a negative return of ~3%.

Deploying Capital

During bear markets or an extended period of a market-wide bear backdrop, investors have the unique opportunity to purchase heavily discounted stocks at a fraction of the price when compared to their peaks.

As history indicates, establishing long-term positions during corrections can lead to outsized gains over the intermediate and long term. As the selling pressure abates and the macroeconomic backdrop resolves, building equity stakes in high-quality companies bodes well for long term investors.

As the macro issues resolve over time, the markets will regain their footing and appreciate higher. The current market backdrop is the exact scenario where investors should be deploying cash on-hand to snap up heavily discounted merchandise in a diversified and dollar cost averaging manner.

Behind the Inflation Curve

The Federal Reserve has fallen far behind the inflation curve, putting through reactive interest rate hikes of 1.5 percentage points, with more to come throughout 2022.

Many politicians and executives have been sounding the inflation alarm since Q4 of 2021 to no avail while the Fed continued to buy bonds and pump liquidity into the system.

The latest inflation numbers by the Labor Department came in at 8.6%, the highest since December 1981. The reactionary Fed and runaway inflation have caused havoc on Wall Street while the Fed attempts to slam the breaks on the economy.

Second Half Bounce?

Although the first half of this year ranks among the worst in history, the selling may ease in the second half if history is any guide.

When the S&P 500 plunged 21% in the first half of 1970, it promptly reversed those losses to gain 26.5% in the second half and post a slight gain for the year. 1932, 1940, 1962 and 1970 saw first half decimation on par with 2022 however every one of those years saw a second half rebound.

Only one year saw the market recover the losses it incurred during the first half, in 1970 (Figure 1).

Figure 1

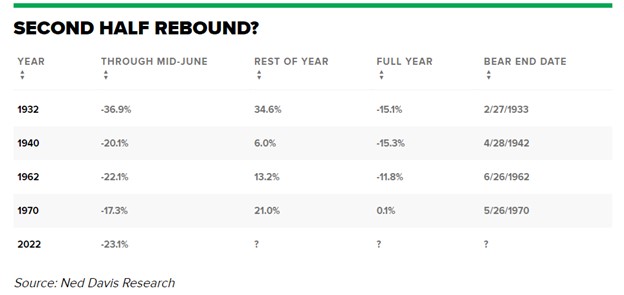
Figure 1 – Historical perspective of worst first half market performances and the respective full year outcomes when factoring in the second half of the year

Recession Possibility and Type

With the possibility of recession, there’s different underpinnings of a bear market that are broken out into cyclical-driven, structural-driven and “event-driven” stock declines of 20% or more.

Goldman Sachs (GS) holds the position that investors are experiencing a cyclical bear market which is marked by high inflation and rising interest rates. This combination results in price-to-earnings multiple contraction and thus a reduction in valuations.

The current climate is buffered against a structural bear market that is buoyed by strong corporate and household balance sheets. The positive side is that the average cyclical bear market lasts two years, far shorter than the average three in half years for a structural bear market. The average price decline during a cyclical bear market is only about 31% versus 57% during a structural one per Goldman.

Cash On-Hand

Deploying cash into an environment where the selling is relentless and indiscriminate can be a daunting task. However, for any portfolio structure, having cash on-hand is essential and in these environments is where this cash should be deployed in equities.

This cash position provides investors with flexibility and agility when faced with market corrections. Cash enables investors to be opportunistic and capitalize on stocks that have sold off and have become de-risked.

Initiating new positions and dollar cost averaging during these extended periods of weakness are great long-term drivers of portfolio appreciation. Absent of any systemic risk, there’s a lot of fantastic entry points for many high-quality large cap companies. Investors should not remiss and capitalize on this buying opportunity because it may not last too long.

Anchoring and Dollar Cost Averaging

Purchasing stocks at the exact bottom is nearly impossible however purchasing stocks at attractive valuations in a disciplined manner over time is possible.

Dollar cost averaging is a great strategy to use when anchoring down into a position with an initial sum of capital and following through with additional incremental purchases as the stock declines further. The net benefit is reducing the average purchase price per share in a sequential fashion (i.e., reducing cost basis). An example of building out a high-quality portfolio with subsequent dollar cost averaging throughput this market weakness can be seen in Figure 2.

Figure 2

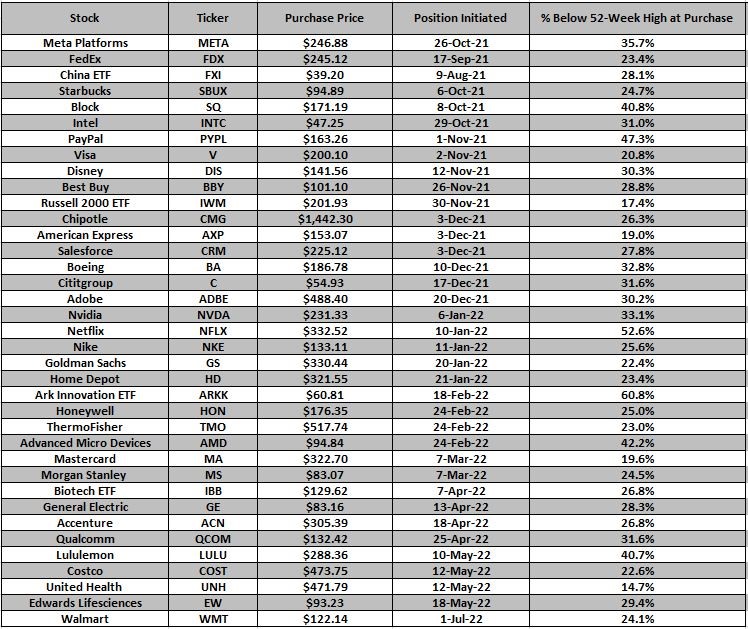
Figure 2 – Initiating positions in high quality companies with subsequent dollar cost averaging to build out a well-diversified portfolio. These long equity trades along with options-based trades can be found via the Trade Notification service.

Conclusion

This has been the stock market’s worst first-half in over 50 years where no sector has been immune from the breath and reach of this bear market. The S&P 500, Nasdaq and Russell 2000 are well in bear market territory at June’s end.

Despite this massive wealth destruction, strategists from major Wall Street firms are forecasting that stocks will recapture most of their losses in the back half of the year. The S&P 500 is expected to finish the year more than 20% higher from the end of June’s levels per top Wall Street strategists.

Purchasing stocks at the exact bottom is nearly impossible however purchasing stocks at attractive valuations in a disciplined manner over time is possible. During bear markets, investors have the unique opportunity to purchase heavily discounted stocks at a fraction of the price when compared to their peaks.

As history indicates, establishing long-term positions during corrections can lead to outsized gains over the intermediate and long term. As the selling pressure abates and the macroeconomic backdrop resolves, building equity stakes in high-quality companies bodes well for investors. The current market backdrop is the exact scenario where investors should be deploying cash on-hand to snap up heavily discounted merchandise.

Noah Kiedrowski
INO.com Contributor

Disclosure: Stock Options Dad LLC is a Registered Investment Adviser (RIA) firm specializing in options-based services and education. There are no business relationships with any companies mentioned in this article. This article reflects the opinions of the RIA. Any recommendation contained in this article is subject to change at any time. No recommendation is intended to constitute an entire portfolio. The author encourages all investors to conduct their own research and due diligence prior to investing or taking any actions in options trading. Please feel free to comment and provide feedback; the author values all responses. The author is the founder and Managing Member of Stock Options Dad LLC – A Registered Investment Adviser (RIA) firm www.stockoptionsdad.com defining risk, leveraging a minimal amount of capital and maximizing return on investment. For more engaging, short-duration options-based content, visit Stock Options Dad LLC’s YouTube channel. Please direct all inquires to

in**@st*************.com


. The author holds shares of AAPL, ACN, ADBE, AMD, AMZN, ARKK, AXP, BA, BBY, C, CMG, COST, CRM, DIA, DIS, EW, FB, FDX, FXI, GOOGL, GS, HD, HON, IBB, INTC, IWM, JPM, LULU, MA, MS, MSFT, NKE, NVDA, PYPL, QCOM, QQQ, SBUX, SPY, SQ, TMO, UNH and V.

Will Cresco Labs (CRLBF) See Higher Highs?

Markets continue to be volatile, with inflation and fears of a potential recession still making the rounds. Despite wild swings in the market, the S&P 500 was flat, while the cannabis sector (as measured by the AdvisorShares Pure US Cannabis ETF) moved slightly higher from a low of $10.08 to a recent high of $11.26 over the last week.

Sure, over the long term, the marijuana sector has been hammered. However, I still believe now is an excellent time for investors to increase their exposure with many marijuana stocks severely oversold and solid catalysts on the horizon.

Marijuana is finding more support throughout the U.S. Rhode Island, for example, recently legalized recreational use, with the market expected to launch by December 1. Mississippi legalized its medical use and is on track for sales to start later this year or early 2023.

In addition, according to The Baltimore Sun, “Legalization of recreational cannabis in Maryland is a done deal. The referendum scheduled on the issue this November will pass.”

Americans believe that marijuana should be legalized. In fact, according to Pew Research, 91% of U.S. adults say it should be legal for medical and recreational use. About 60% say it should be legalized for medical use. Around 8% disagree with legalization altogether.

With that in mind, I am taking a closer look at Cresco Labs (CRLBF).

Cresco Labs is one of the largest vertically-integrated multi-state cannabis operators (MSOs) in the United States. With a consumer-packaged goods approach to cannabis, Cresco’s house of brands is designed to meet the needs of all consumer segments. The company boasts some of the most recognized and trusted national brands, including Cresco, Remedi, and Mindy’s, a line of edibles created by James Beard Award-winning chef Mindy Segal.

This post will discuss the company’s background, critical catalysts for growth, risks, and a quick takeaway on why investors may want to consider CRLBF as a long-term play.

Business Overview

Cresco Labs is one of the largest vertically-integrated multi-state cannabis operators in the U.S. The company has been actively acquiring businesses to expand its market share across the U.S., including a deal with Columbia Care for $2B that could close by Q4 2022.

Cresco operates in 10 U.S. states, runs 21 production facilities, holds 51 retail licenses, and owns 50 dispensaries. Based on its strong revenue growth, shares of Cresco could see higher highs. First-quarter revenue of $214 million was up 20% year-over-year. Retail revenue also jumped 44%.

Moving forward, Cresco holds immense potential.

By 2025, the company could have access to 12 states, with more than $1 billion in sales potential. As noted in the company's investor deck, it could have access to 180 million U.S. adults or more than 70% of the addressable cannabis market.

Even better, the company carries some of the most popular cannabis brands in the U.S.

Cresco Brands

Source: Cresco Labs

In addition, according to Cresco Labs:

“With a portfolio consisting of approximately 350 products and over 5,000 SKUs, Cresco Labs’ products are sold in over 1000 dispensaries across the country. The CPG and wholesale strategy enable us to maximize its points of distribution and drive revenue growth independent of the expansion of its retail presence. We prioritize wholesale in order to reach as many consumers as possible, accessing the scaled benefits of a national footprint.”

Growth Drivers

One of the top catalysts for Cresco Labs is its partnerships, especially its latest one with Columbia Care.

  1. The acquisition will give Cresco Labs one of the largest pro forma revenue in the cannabis industry at over $1.4 billion, says the company.
  2. Columbia Care now gives Cresco access to over 130 retail stores across 18 markets.
  3. The deal will increase Cresco’s market share in key states, “bringing the combined company to a material market position in seven of the top 10 markets by revenue in 2025,” added Cresco Labs.

“This acquisition brings together two of the leading operators in the industry, pairing a leading footprint with proven operational, brand, and competitive excellence. The combination is highly complementary and provides unmatched scale, depth, diversification, and long-term growth.

On a proforma basis, the combined company will be the largest cannabis company by revenue, the number one wholesaler of branded cannabis products, and the largest nationwide retail footprint outside of Florida,” added Charles Bachtell, CEO of Cresco Labs.

Key Risks

As with any industry, there are risks, especially in today’s volatile environment. For one, we must consider that the cannabis industry is highly regulated, fragmented state-by-state structures, and hiccups with federal legalization.

That makes the industry far more volatile, even with more states legalizing the use of cannabis and even with 91% of Americans saying it should be legal for recreational and medicinal use.

We also have to consider fears of recession, and inflation, which could lead to a potential increase in raw materials, supplies, and other equipment. However, don’t let these risks chase you from the cannabis sector or growing stocks like Cresco Labs.

Once more states legalize its use and the federal government gets around to legalization, stocks like Cresco Labs may never be this inexpensive again.

Key Takeaways

To review, Cresco Labs is one of the largest vertically-integrated multi-state cannabis operators in the United States. The company has been actively acquiring businesses to expand its market share across the U.S. Cresco is also acquiring multi-state operator (MSO) Columbia Care for $2 billion in a deal that could close by the fourth quarter of the year.

Cresco (CRLBF) Chart

Source: Stockcharts.com

That acquisition will give Cresco Labs one of the largest pro forma revenue in the cannabis industry at over $1.4 billion, says the company. In addition, Columbia Care now gives Cresco access to over 130 retail stores across 18 markets.

Finally, the deal will increase Cresco’s market share in key states, “bringing the combined company to a material market position in seven of the top 10 markets by revenue in 2025,” added Cresco Labs.

Even with potential risks, Cresco Labs (CRLBF) looks like an attractive buy opportunity.

Ian Cooper
INO.com Contributor

Disclosure: This contributor did not hold a position in any investment mentioned above at the time this blog post was published. This article is the opinion of the contributor themselves. The above is a matter of opinion provided for general information purposes only and is not intended as investment advice. This contributor is not receiving compensation (other than from INO.com) for their opinion.

Copper Fears Recession

The copper futures hit an all-time high this spring. This is not a surprise to many readers who suspected it would - see the poll from late August.

The price has topped at $5.04, missing the preset target area between $5.36-$5.41. After that, copper futures collapsed below the valley of the last summer ($3.96) in the area of $3.60.

See the latest stats for the copper market in the table below.

World Refined Copper Usage and Supply Trends

Source: The International Copper Study Group (ICSG)

According to the table above, the world refined copper production has increased to 8.44 million metric tons in the first four months this year, compared to 8.16 million metric tons for the same period last year.

At the same time, the world usage or demand has grown up either to 8.35 million metric tons in January-April this year from 8.17 million metric tons last year.

As a result, this year the copper balance turned into a surplus of 95 thousand metric tons compared to a deficit of 3 thousand metric tons last year. Moreover, if we take the last line of the table that shows the refined balance of the market adjusted for the Chinese bonded stock change is in even bigger oversupply of 213 thousand metric tons.

As we can see, the market fundamentals could have undermined the uptrend in the copper price in the first place. The following speed up of the futures collapse was fueled by the hawkish Fed, Chinese lockdowns and a new scaring mantra that has been circulating recently in the media about upcoming recession.

One could call it a self-fulfilling prophecy as last Friday the Atlanta Fed posted a second quarterly decline of a real GDP in a row on its GDPNow tracker. The second quarter reading is minus 2.1%, the first quarter reading was minus 1.6%. Technically speaking, this could mean that the forecasted recession is already here.

The auxiliary economic data from the graphs below also confirms the economic headwinds for the copper market.

US PMI vs Copper

Source: tradingeconomics.com

United States ISM Purchasing Managers Index (PMI) (blue) fell to 53 in June of 2022 from 56.1 in May, demonstrating the slowest growth in factory activity since June of 2020, and below market forecasts of 54.9.

The robust uptrend of copper futures (black) in 2020 was in an accord with U.S. PMI until the start of 2021 where the factory activity has peaked and then started to collapse. The copper price firstly continued further up on the market inertia and then dropped huge to finally catch up with the current fundamentals.

China Industrial Production vs Copper

Source: tradingeconomics.com

The similar situation has been seen in the chart above of Chinese industrial production (blue). The “World’s factory” performance has also peaked last year, ahead of the top in copper futures (black).

We could see here that the metal has more room to the downside into the $3 area to reach the corresponding level of Chinese data. It is worth to note that the industrial production in China has grown up by 0.7% recently after a relaxation in COVID-19 curbs in some major Chinese cities.

US Consumer Sentiment vs Copper

Source: tradingeconomics.com

To complete the picture, we should look at the chart above that shows the U.S. consumer confidence (blue) as a main indicator of the initial demand.

The situation is even more depressed here as we can see no progress since the pandemic outbreak. The indicator just made a small rebound within the consolidation in 2020 and then continued to the downside to hit the record low of 50.0 in June 2022.

Let’s look at the updated chart of copper futures below.

Copper Futures Monthly

Source: TradingView

The copper futures price goes well with the plan posted almost a year ago. It didn’t advance too much to the upside to fit with the extended consolidation pattern. We entered the red leg 2 down.

The latter could unfold either like the first straight leg down with a panic selling amid financial crisis of 2008 or it could build a zigzag with a corrective phase in the middle of the drop. More often than not, two legs are not alike.

Two possible downward targets could be set. The closest one is computed using the distance of the first red leg down subtracted from the new all-time high; it is aimed at $2.02. This area coincides with the valley of 2016 and 2020.

The next target is an old one as it Is located at the minimum of the first red leg down at $1.25.

The RSI sank below the so-called “waterline” beneath the crucial 50 level. If it closes this month there than the bearish trend is confirmed.

How deep could the copper futures collapse?

View Results

Loading ... Loading ...

Intelligent trades!

Aibek Burabayev
INO.com Contributor

Disclosure: This contributor has no positions in any stocks mentioned in this article. This article is the opinion of the contributor themselves. The above is a matter of opinion provided for general information purposes only and is not intended as investment advice. This contributor is not receiving compensation (other than from INO.com) for their opinion.