Weekly Futures Recap With Mike Seery

We’ve asked Michael Seery of SEERYFUTURES.COM to give our INO readers a weekly recap of the Futures market. He has been Senior Analyst for close to 15 years and has extensive knowledge of all of the commodity and option markets.

Michael frequently appears on multiple business networks including Bloomberg news, Fox Business, CNBC Worldwide, CNN Business, and Bloomberg TV. He is also a guest on First Business, which is a national and internationally syndicated business show.

Gold Futures

Gold futures in New York this week were slightly higher settling at 1,288 after rallying $20 in yesterday’s trade as renewed optimism about the Federal Reserve continuing its quantitative easing for years to come pushing prices sharply higher after hitting a 5 week low down at 1,260 earlier in the week still continuing its downtrend in my opinion. The next major support is at 1,251 and if that level is broken you would have to think that prices will go down & retest the June lows of 1,180 but this market has been resilient when it looks its worst it has a tremendous rally & when it looks really good it has a tremendous sell off so at this point I would advise sitting on the sidelines and wait for a breakout to occur below 1,251 before entering to the downside as demand has hit a 4 year low as investors continue to pour money into the stock market and continues to sell gold and the precious metals and that is why you see the divergence between the S&P 500 and gold prices. Gold is trading far below its 20 and 100 day moving average which tells you that the trend in the short term is lower but this market has been very choppy for quite some time so look at some other commodities like the S&P 500 because a trendy market is much easier to make money then a choppy market.
TREND: LOWER
CHART STRUCTURE: EXCELLENT
Continue reading "Weekly Futures Recap With Mike Seery"

It's Friday and You Know What To Do

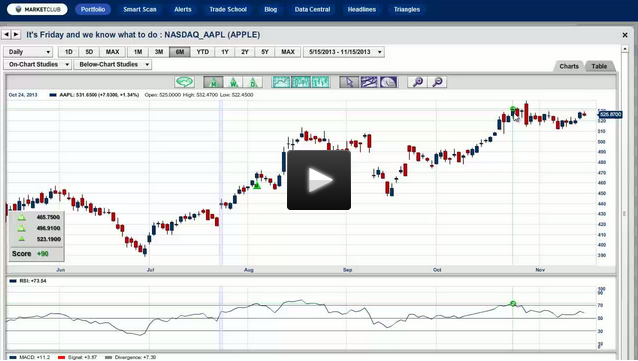
Hello traders everywhere! Adam Hewison here, President of INO.com and Co-creator of MarketClub, with your mid-day market update for Friday, the 15th of November.

It has been quite a week! It's Friday and time to look for new 52-week highs in the markets. It was a strong week for the indices and several of the markets I am following, so after a quick recap of the major markets, I will show you how to find new 52-week highs and the rules you need to trade them.

Here are the only three rules you need to trade "The 52-Week New Highs on Friday": Continue reading "It's Friday and You Know What To Do"

Like Clockwork, Freeport-McMoRan (FCX)

One of the many benefits of MarketClub is having a great network of traders who use our service and share their ideas. This particular stock idea came from Harold, who has been a member of MarketClub for several years. Harold shared his stock idea with other members of our Member Blog yesterday.

This morning, I decided to take a look at Harold's stock idea, Freeport-McMoRan (NYSE:FCX). What immediately caught my attention was the rhythmic nature of this stock and how it almost performed like clockwork.

1. RSI indicator
2. Downtrend line and breakout
3. Major low established after trend line breakout
4. First cyclic low, 28 days after major low
5. Second cyclic low, 23 days after previous low
6. Third cyclic low, 28 days after previous low
7. Potential fourth cyclic low, 26 days after previous low
8. Potential upside target $40 Continue reading "Like Clockwork, Freeport-McMoRan (FCX)"

Chart to Watch - Facebook (FB)

We've asked our friend Jim Robinson of profittrading.com to provide his expert analysis of charts to our readers. Each week he'll be analyzing a different chart using the Trade Triangles and his experience.

Today he is going to take a look at the technical picture of the Facebook (NASDAQ:FB).

I hope you are having a GREAT week !

When trading stocks with the MarketClub system we use the monthly MarketClub Trade Triangle to tell the trend and the weekly MarketClub Trade Triangle to time the entry and exit points. Continue reading "Chart to Watch - Facebook (FB)"

Exxon Mobil - The Surprising Big Chart Picture

While viewing my energy portfolio this morning, I stopped and looked at the chart for Exxon Mobile (NYSE:XOM). I immediately noticed major resistance coming in at the $95 level. Can Exxon break through this major resistance level and take off to the upside?

If I measure from the resistance at $95 all the way down to the low in July of 2010, the difference is around $35. If I then add $35 to the breakout point, it takes us to my target zone of $130 per share for Exxon. Now remember, the market must move over the $95 level for this to happen.

Let's take a look at what we can see on the chart. Continue reading "Exxon Mobil - The Surprising Big Chart Picture"