

This topic was promised in one of my previous posts to our readers, and I am pleased to offer it to you today. I was waiting to see the end of the month price action to try to write when I considered all the moves within a month for more accuracy. Carol and Diane, I should admit you are very brave ladies as when I opened GYEN (The AdvisorShares Gartman Gold/Yen ETF (NYSE Arca: GYEN)) chart I was shocked by all the crazy and abrupt moves there. The history of this ETF is quite short (from 2014), and the analysis based on it would not be solid. At the end of the post, I've added the GYEN chart for you to judge for yourself. I picked the gold/JPY chart instead for analysis as the ETF tracks the price of this pair. I hope you will enjoy the post.
Chart 1. Gold/JPY Monthly: Multi-Decade Uptrend Is Intact
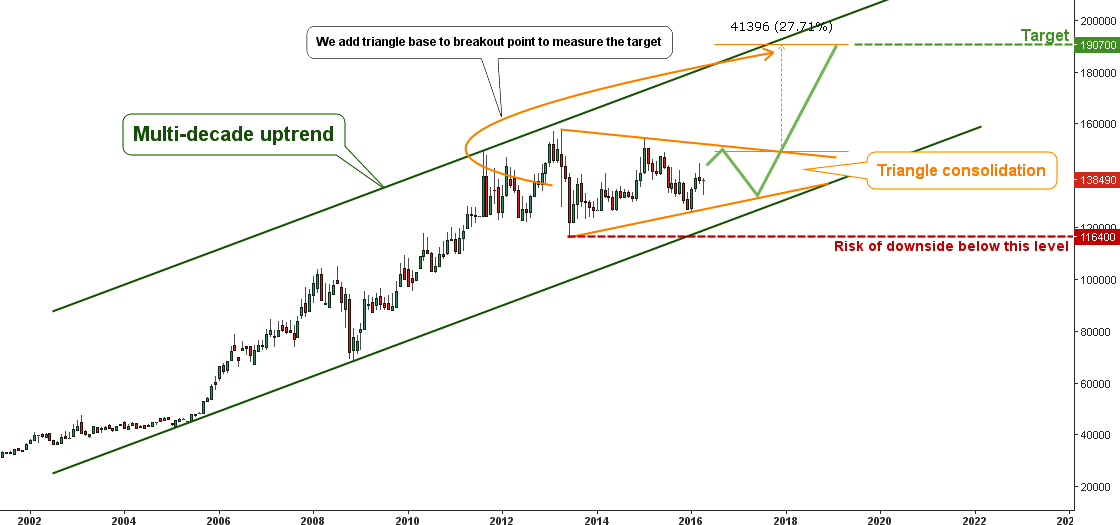
Chart courtesy of tradingview.com
The multi-decade uptrend highlighted in the chart reflects the trends of both the gold/$ and $/JPY markets. Those markets were extremely bullish for the past decade, and the gold/JPY strong upside move shows the synergy of them. The Big Bull Run here stalled in 2013 while gold/$ stalled two years earlier in 2011. The reason is that the $/JPY bullish move stopped last year and helped to extend the upside move in gold/JPY and then to soften the downside pressure from the falling gold/$. Continue reading "The Japanese Gold Trapped In A Large Consolidation"