Was The Collapse of SVB a Black Swan?

According to some doomsayers, the stock market is on the brink of a crash, and the collapse of Silicon Valley Bank (SVB) is being considered as a potential "Black Swan" event.

They believe it could trigger a domino effect similar to the Lehman Brothers collapse in 2008. There are already indications of this, as the failure of SVB has had a ripple effect in Europe, with the second largest Swiss bank, Credit Suisse, also being hit.

YTD SPF IXG SIVB JPM BAC CS

Source: TradingView

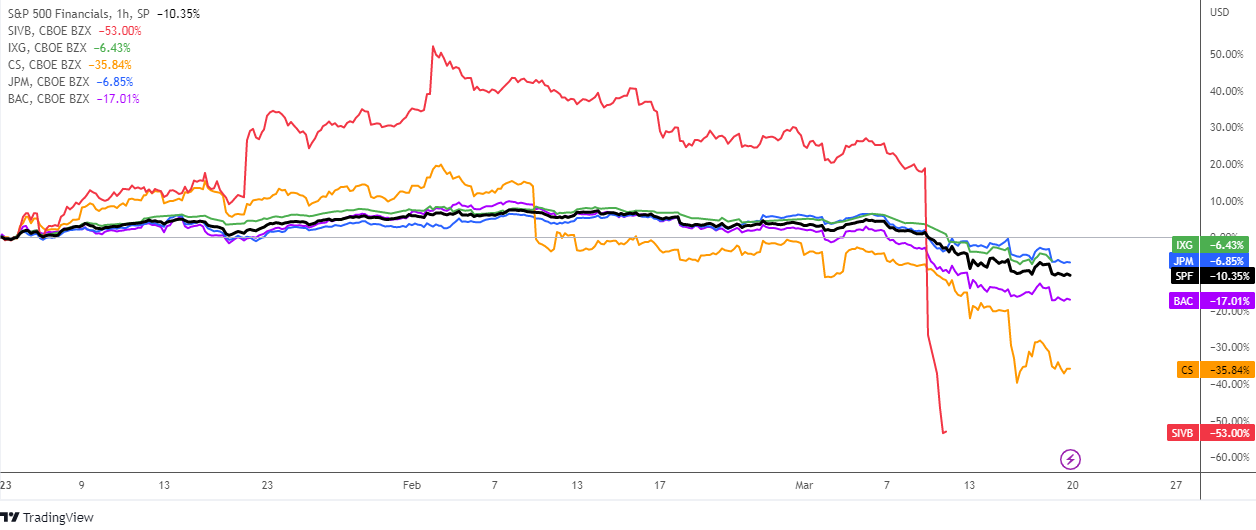
In the comparative chart above there is a year-to-date dynamics of S&P 500 Financials index (SPF, black), the iShares Global Financials ETF (IXG, green), SVB Financial Group (SIVB, red), Credit Suisse (CS, orange), JPMorgan Chase (JPM, blue) and Bank of America (BAC, purple).

On the chart, all of the lines indicate negative performance, with each one below the zero mark. Indeed, SVB and CS are the ultimate losers, while BAC is also suffering a significant loss at -17.01%. Meanwhile, IXG, JPM, and SPF fared slightly better, with losses of -6.43%, -6.85%, and -10.35%, respectively.

This indicates that banking stocks around the world are losing ground following the trigger from SVB, as seen with the decline in IXG and the top two banks in the US. Continue reading "Was The Collapse of SVB a Black Swan?"

Financial Sector May Rally 11% - 15% Higher

The financial sector is poised for a very strong rally into the end of 2021 and early 2022 as revenues and earnings for Q4:2021 should continue to drive an upward price trend. The US Federal Reserve is keeping interest rates low. At the same time, the US consumer continues to drive home purchases and holiday shopping. Strong economic data should drive Q4 results for the financial sector close to levels we saw in Q3:2021. If that happens, we may see a robust rally in the US Financial sector over the next 45 to 60+ days.

The strength of the recent rally in the US major indexes shows just how powerful the bullish trend bias is right now. Some traders focus on the downside risks associated with the US Federal Reserve actions and/or the concerns related to inflation and global markets. I, however, continue to focus on the strength in the US major indexes and various sector trends that show real opportunities for profits.

Comparing Sector Strength

The following two US market sector charts highlight the performance over the last 12 vs. 24 months. I want readers to pay attention to how flat the Financial Sector has stayed since just before the 2020 COVID event and how the Financial Sector has started to trend higher over the past 12 months. This is because the shock of COVID briefly disrupted consumer activity. Yet, consumers are coming back strong, driving retail sales, home sales, and the continued strong US economic data. Therefore, it makes sense that the Financial sector should continue to show firm revenue and earnings growth while the US consumer is active and spending. Continue reading "Financial Sector May Rally 11% - 15% Higher"

US Stock Markets Could Rally Beyond Expectations

Late Sunday afternoon, President Trump surprised the global markets with the announcement of increased trade tariffs with China relating to the ongoing trade negotiations and delayed trade talks between the two global superpowers. The global markets reacted immediately upon the open Sunday night (Asian open). The VIX short position puts quite a bit of professional traders at risk of big losses today while those of us that were prepared for an increase in volatility and price rotation is poised for some incredible opportunities.

The US stock market is set up for a price move that will likely make many people very wealthy while frustrating many others over the next few months. We’ve recently posted many articles regarding the 2020 US Presidential election cycle and the fear cycle that comes from these major political events. In November 2016, we remember watching Gold rally $60 early in the election night, then fall $100 as news began reporting the surprise winner. There is so much capital, and future capital expectations that ride on these election cycles – it can actually drive the markets in one direction or another.

Right now, we have two things we want to alert you to regarding our proprietary Fibonacci price modeling utility. First, the current trend is Bullish and the chance of a downside price move is still valid. Remember, one of the primary price rules within Fibonacci price theory is that price must ALWAYS attempt to seek out new highs and new lows – at all times. This means that once price establishes new price highs, any failure to continue establishing new price highs, through standard price rotation, will result in its price attempting to establish new price lows. Continue reading "US Stock Markets Could Rally Beyond Expectations"

How Close Are The Markets From Topping?

Now that most of the US Major Indexes have breached new all-time price highs, which we called over 5+ months ago, and many traders are starting to become concerned about how and where the markets may find resistance or begin to top, we are going to try to paint a very clear picture of the upside potential for the markets and why we believe volatility and price rotation may become a very big concern over the next few months. Our objective is to try to help you stay informed of pending market rotation and to alert you that we may be nearing a period within the US markets where increased volatility is very likely.

Longer term, many years into the future, our predictive modeling systems are suggesting this upside price swing is far from over. Our models suggest that price rotation will become a major factor over the next 12 to 15+ months – headed into the US Presidential election cycle of November 2020. Our models are suggesting that the second half of this year could present an incredible opportunity for skilled investors as price volatility/rotation provide bigger price swings. Additionally, our models suggest that early 2020 will provide even more opportunity for skilled traders who are able to understand the true price structure of the markets. Get ready, thing are about to get really interesting and if you are not following our research or a member of our services, you might want to think about joining soon.

We are focusing this research post on the NQ, ES and YM futures charts (Daily). We will include a longer-term YM chart near the end to highlight longer-term expectations. Let’s start with the NQ Daily chart. Continue reading "How Close Are The Markets From Topping?"

Financials Setting Up An Island Top Formation

As we continue to scan the charts for setups and trigger to alert our followers, we’ve come across a setup that may be more ominous than what it appears. Recently we’ve posted articles about how the SPY and the NQ have pushed into new all-time high price territory and how Gold is setting up for a momentum base that should launch precious metals to near highs. We’ve also discussed how we believe the current upside price bias in the US stock markets should last another 10~35+ days before new price weakness sets up – possibly pushing prices lower in late May or early June 2019.

Our research team has been scanning the charts looking for anything that could give us an edge to the potential setup for this price weakness in the future. We believe the Transportation Index and the Financials could be keys to understanding how far the upside rally can continue and when a price peak may begin to warn of a potential price top or rollover.

An Island Top is a pattern that sets up with an upside price gap followed by sideways price action above that gap. In theory, this type of setup should promote the gap to be filled with downside price action before any further upside price move can continue. Although, gaps to the upside are fairly common in strong uptrends. Given the strength of the earnings data released early this week and the expectations that we have for some continued upside price bias over the next 10~35+ days, we are watching these Island Top formation in the Financials for any signs of weakness to alert our followers. Continue reading "Financials Setting Up An Island Top Formation"